Moroccan vs Immigrants from Sudan Single Father Poverty
COMPARE
Moroccan
Immigrants from Sudan
Single Father Poverty
Single Father Poverty Comparison
Moroccans
Immigrants from Sudan
17.0%
SINGLE FATHER POVERTY
2.1/ 100
METRIC RATING
242nd/ 347
METRIC RANK
16.2%
SINGLE FATHER POVERTY
59.8/ 100
METRIC RATING
160th/ 347
METRIC RANK
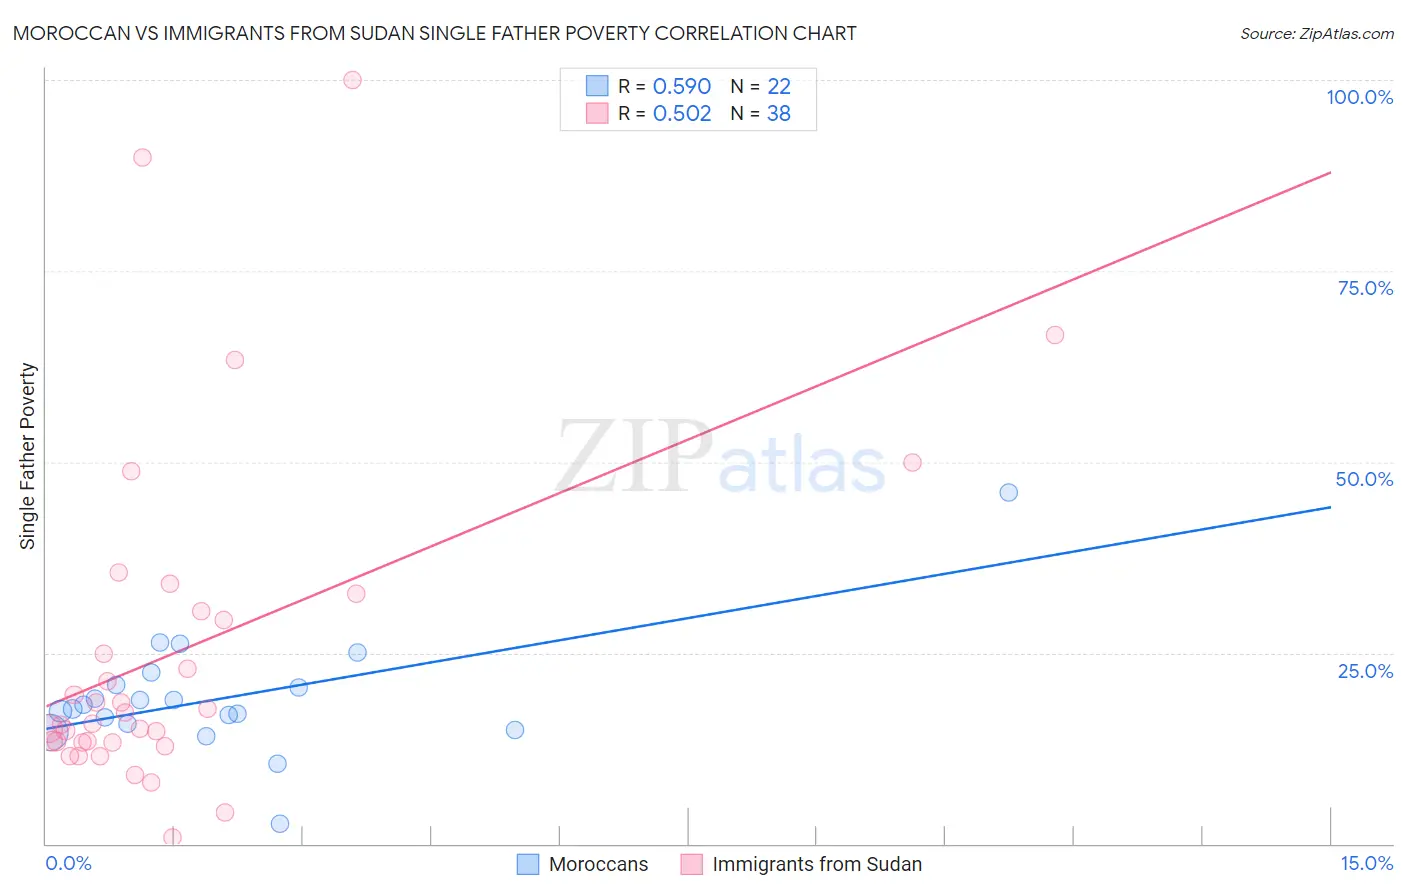
Moroccan vs Immigrants from Sudan Single Father Poverty Correlation Chart
The statistical analysis conducted on geographies consisting of 173,540,722 people shows a substantial positive correlation between the proportion of Moroccans and poverty level among single fathers in the United States with a correlation coefficient (R) of 0.590 and weighted average of 17.0%. Similarly, the statistical analysis conducted on geographies consisting of 108,710,355 people shows a substantial positive correlation between the proportion of Immigrants from Sudan and poverty level among single fathers in the United States with a correlation coefficient (R) of 0.502 and weighted average of 16.2%, a difference of 4.7%.
Single Father Poverty Correlation Summary
| Measurement | Moroccan | Immigrants from Sudan |
| Minimum | 2.6% | 0.76% |
| Maximum | 46.0% | 100.0% |
| Range | 43.4% | 99.2% |
| Mean | 19.1% | 25.5% |
| Median | 17.9% | 16.4% |
| Interquartile 25% (IQ1) | 15.7% | 13.3% |
| Interquartile 75% (IQ3) | 20.7% | 30.5% |
| Interquartile Range (IQR) | 5.0% | 17.2% |
| Standard Deviation (Sample) | 7.9% | 22.2% |
| Standard Deviation (Population) | 7.7% | 21.9% |
Similar Demographics by Single Father Poverty
Demographics Similar to Moroccans by Single Father Poverty
In terms of single father poverty, the demographic groups most similar to Moroccans are Czech (17.0%, a difference of 0.10%), Finnish (16.9%, a difference of 0.22%), Bermudan (16.9%, a difference of 0.23%), Immigrants from Saudi Arabia (16.9%, a difference of 0.25%), and Subsaharan African (16.9%, a difference of 0.32%).
| Demographics | Rating | Rank | Single Father Poverty |
| Immigrants | Western Europe | 2.9 /100 | #235 | Tragic 16.9% |
| Immigrants | Germany | 2.9 /100 | #236 | Tragic 16.9% |
| Sub-Saharan Africans | 2.9 /100 | #237 | Tragic 16.9% |
| Immigrants | Saudi Arabia | 2.7 /100 | #238 | Tragic 16.9% |
| Bermudans | 2.6 /100 | #239 | Tragic 16.9% |
| Finns | 2.6 /100 | #240 | Tragic 16.9% |
| Czechs | 2.3 /100 | #241 | Tragic 17.0% |
| Moroccans | 2.1 /100 | #242 | Tragic 17.0% |
| Immigrants | Cabo Verde | 1.6 /100 | #243 | Tragic 17.0% |
| Hondurans | 1.6 /100 | #244 | Tragic 17.0% |
| Trinidadians and Tobagonians | 1.5 /100 | #245 | Tragic 17.0% |
| Immigrants | Ireland | 1.4 /100 | #246 | Tragic 17.1% |
| Greeks | 1.3 /100 | #247 | Tragic 17.1% |
| Czechoslovakians | 1.3 /100 | #248 | Tragic 17.1% |
| Canadians | 1.3 /100 | #249 | Tragic 17.1% |
Demographics Similar to Immigrants from Sudan by Single Father Poverty
In terms of single father poverty, the demographic groups most similar to Immigrants from Sudan are Belizean (16.2%, a difference of 0.010%), Portuguese (16.2%, a difference of 0.12%), Immigrants from Czechoslovakia (16.2%, a difference of 0.14%), Estonian (16.2%, a difference of 0.14%), and Ugandan (16.3%, a difference of 0.18%).
| Demographics | Rating | Rank | Single Father Poverty |
| Immigrants | Israel | 72.0 /100 | #153 | Good 16.1% |
| Mexicans | 70.1 /100 | #154 | Good 16.1% |
| Immigrants | Nicaragua | 67.8 /100 | #155 | Good 16.2% |
| Immigrants | Jordan | 66.0 /100 | #156 | Good 16.2% |
| Immigrants | Czechoslovakia | 62.8 /100 | #157 | Good 16.2% |
| Portuguese | 62.3 /100 | #158 | Good 16.2% |
| Belizeans | 59.9 /100 | #159 | Average 16.2% |
| Immigrants | Sudan | 59.8 /100 | #160 | Average 16.2% |
| Estonians | 56.7 /100 | #161 | Average 16.2% |
| Ugandans | 55.9 /100 | #162 | Average 16.3% |
| Immigrants | Costa Rica | 55.7 /100 | #163 | Average 16.3% |
| Guyanese | 55.2 /100 | #164 | Average 16.3% |
| Immigrants | Bangladesh | 55.1 /100 | #165 | Average 16.3% |
| Immigrants | Europe | 54.8 /100 | #166 | Average 16.3% |
| Yugoslavians | 53.9 /100 | #167 | Average 16.3% |