French vs Immigrants from Sudan Single Father Poverty
COMPARE
French
Immigrants from Sudan
Single Father Poverty
Single Father Poverty Comparison
French
Immigrants from Sudan
18.2%
SINGLE FATHER POVERTY
0.0/ 100
METRIC RATING
297th/ 347
METRIC RANK
16.2%
SINGLE FATHER POVERTY
59.8/ 100
METRIC RATING
160th/ 347
METRIC RANK
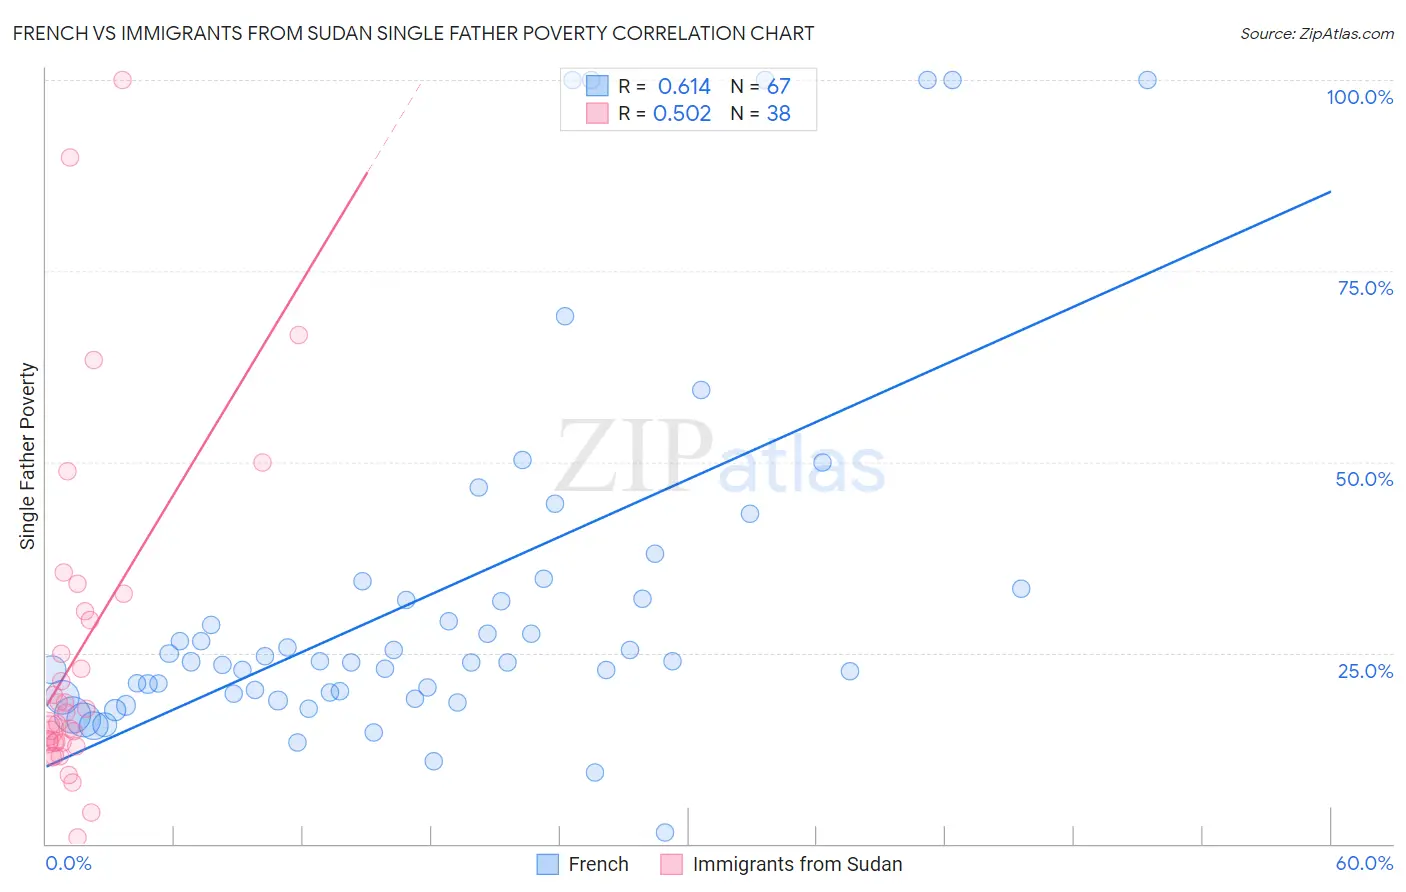
French vs Immigrants from Sudan Single Father Poverty Correlation Chart
The statistical analysis conducted on geographies consisting of 409,472,161 people shows a significant positive correlation between the proportion of French and poverty level among single fathers in the United States with a correlation coefficient (R) of 0.614 and weighted average of 18.2%. Similarly, the statistical analysis conducted on geographies consisting of 108,710,355 people shows a substantial positive correlation between the proportion of Immigrants from Sudan and poverty level among single fathers in the United States with a correlation coefficient (R) of 0.502 and weighted average of 16.2%, a difference of 12.1%.
Single Father Poverty Correlation Summary
| Measurement | French | Immigrants from Sudan |
| Minimum | 1.4% | 0.76% |
| Maximum | 100.0% | 100.0% |
| Range | 98.6% | 99.2% |
| Mean | 32.5% | 25.5% |
| Median | 23.8% | 16.4% |
| Interquartile 25% (IQ1) | 19.7% | 13.3% |
| Interquartile 75% (IQ3) | 33.3% | 30.5% |
| Interquartile Range (IQR) | 13.7% | 17.2% |
| Standard Deviation (Sample) | 24.1% | 22.2% |
| Standard Deviation (Population) | 23.9% | 21.9% |
Similar Demographics by Single Father Poverty
Demographics Similar to French by Single Father Poverty
In terms of single father poverty, the demographic groups most similar to French are Seminole (18.1%, a difference of 0.21%), Yakama (18.1%, a difference of 0.31%), U.S. Virgin Islander (18.1%, a difference of 0.37%), Alaska Native (18.1%, a difference of 0.40%), and Immigrants from Bahamas (18.1%, a difference of 0.51%).
| Demographics | Rating | Rank | Single Father Poverty |
| West Indians | 0.0 /100 | #290 | Tragic 18.0% |
| Alaskan Athabascans | 0.0 /100 | #291 | Tragic 18.1% |
| Immigrants | Bahamas | 0.0 /100 | #292 | Tragic 18.1% |
| Alaska Natives | 0.0 /100 | #293 | Tragic 18.1% |
| U.S. Virgin Islanders | 0.0 /100 | #294 | Tragic 18.1% |
| Yakama | 0.0 /100 | #295 | Tragic 18.1% |
| Seminole | 0.0 /100 | #296 | Tragic 18.1% |
| French | 0.0 /100 | #297 | Tragic 18.2% |
| Africans | 0.0 /100 | #298 | Tragic 18.3% |
| Whites/Caucasians | 0.0 /100 | #299 | Tragic 18.4% |
| Immigrants | Dominican Republic | 0.0 /100 | #300 | Tragic 18.4% |
| Hungarians | 0.0 /100 | #301 | Tragic 18.5% |
| Comanche | 0.0 /100 | #302 | Tragic 18.5% |
| Celtics | 0.0 /100 | #303 | Tragic 18.5% |
| Ute | 0.0 /100 | #304 | Tragic 18.5% |
Demographics Similar to Immigrants from Sudan by Single Father Poverty
In terms of single father poverty, the demographic groups most similar to Immigrants from Sudan are Belizean (16.2%, a difference of 0.010%), Portuguese (16.2%, a difference of 0.12%), Immigrants from Czechoslovakia (16.2%, a difference of 0.14%), Estonian (16.2%, a difference of 0.14%), and Ugandan (16.3%, a difference of 0.18%).
| Demographics | Rating | Rank | Single Father Poverty |
| Immigrants | Israel | 72.0 /100 | #153 | Good 16.1% |
| Mexicans | 70.1 /100 | #154 | Good 16.1% |
| Immigrants | Nicaragua | 67.8 /100 | #155 | Good 16.2% |
| Immigrants | Jordan | 66.0 /100 | #156 | Good 16.2% |
| Immigrants | Czechoslovakia | 62.8 /100 | #157 | Good 16.2% |
| Portuguese | 62.3 /100 | #158 | Good 16.2% |
| Belizeans | 59.9 /100 | #159 | Average 16.2% |
| Immigrants | Sudan | 59.8 /100 | #160 | Average 16.2% |
| Estonians | 56.7 /100 | #161 | Average 16.2% |
| Ugandans | 55.9 /100 | #162 | Average 16.3% |
| Immigrants | Costa Rica | 55.7 /100 | #163 | Average 16.3% |
| Guyanese | 55.2 /100 | #164 | Average 16.3% |
| Immigrants | Bangladesh | 55.1 /100 | #165 | Average 16.3% |
| Immigrants | Europe | 54.8 /100 | #166 | Average 16.3% |
| Yugoslavians | 53.9 /100 | #167 | Average 16.3% |