Moroccan vs Latvian Single Father Poverty
COMPARE
Moroccan
Latvian
Single Father Poverty
Single Father Poverty Comparison
Moroccans
Latvians
17.0%
SINGLE FATHER POVERTY
2.1/ 100
METRIC RATING
242nd/ 347
METRIC RANK
16.5%
SINGLE FATHER POVERTY
28.9/ 100
METRIC RATING
189th/ 347
METRIC RANK
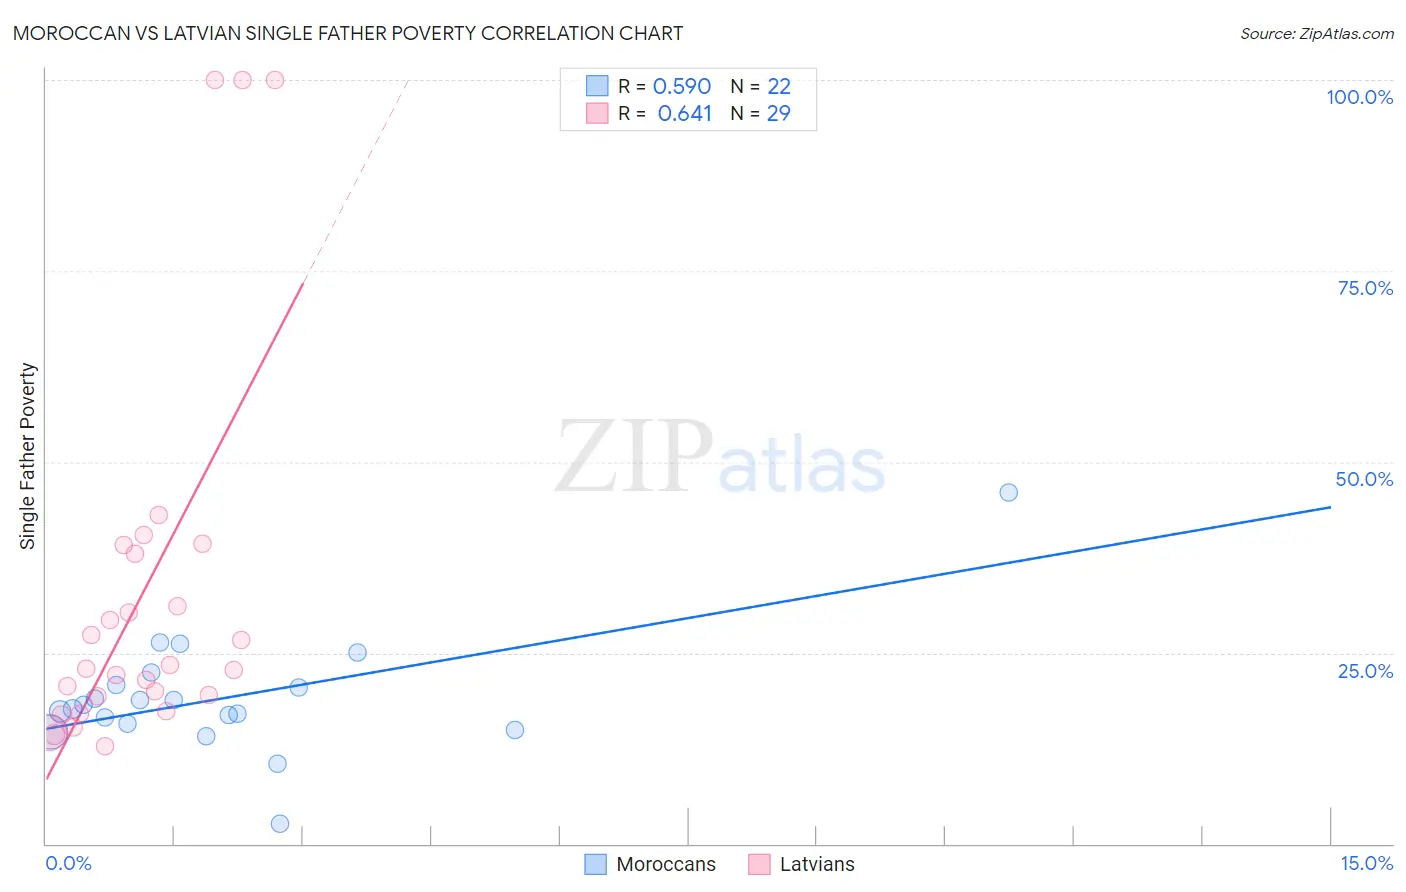
Moroccan vs Latvian Single Father Poverty Correlation Chart
The statistical analysis conducted on geographies consisting of 173,540,722 people shows a substantial positive correlation between the proportion of Moroccans and poverty level among single fathers in the United States with a correlation coefficient (R) of 0.590 and weighted average of 17.0%. Similarly, the statistical analysis conducted on geographies consisting of 180,631,509 people shows a significant positive correlation between the proportion of Latvians and poverty level among single fathers in the United States with a correlation coefficient (R) of 0.641 and weighted average of 16.5%, a difference of 3.2%.
Single Father Poverty Correlation Summary
| Measurement | Moroccan | Latvian |
| Minimum | 2.6% | 12.7% |
| Maximum | 46.0% | 100.0% |
| Range | 43.4% | 87.3% |
| Mean | 19.1% | 32.6% |
| Median | 17.9% | 22.9% |
| Interquartile 25% (IQ1) | 15.7% | 18.3% |
| Interquartile 75% (IQ3) | 20.7% | 38.6% |
| Interquartile Range (IQR) | 5.0% | 20.2% |
| Standard Deviation (Sample) | 7.9% | 24.8% |
| Standard Deviation (Population) | 7.7% | 24.4% |
Similar Demographics by Single Father Poverty
Demographics Similar to Moroccans by Single Father Poverty
In terms of single father poverty, the demographic groups most similar to Moroccans are Czech (17.0%, a difference of 0.10%), Finnish (16.9%, a difference of 0.22%), Bermudan (16.9%, a difference of 0.23%), Immigrants from Saudi Arabia (16.9%, a difference of 0.25%), and Subsaharan African (16.9%, a difference of 0.32%).
| Demographics | Rating | Rank | Single Father Poverty |
| Immigrants | Western Europe | 2.9 /100 | #235 | Tragic 16.9% |
| Immigrants | Germany | 2.9 /100 | #236 | Tragic 16.9% |
| Sub-Saharan Africans | 2.9 /100 | #237 | Tragic 16.9% |
| Immigrants | Saudi Arabia | 2.7 /100 | #238 | Tragic 16.9% |
| Bermudans | 2.6 /100 | #239 | Tragic 16.9% |
| Finns | 2.6 /100 | #240 | Tragic 16.9% |
| Czechs | 2.3 /100 | #241 | Tragic 17.0% |
| Moroccans | 2.1 /100 | #242 | Tragic 17.0% |
| Immigrants | Cabo Verde | 1.6 /100 | #243 | Tragic 17.0% |
| Hondurans | 1.6 /100 | #244 | Tragic 17.0% |
| Trinidadians and Tobagonians | 1.5 /100 | #245 | Tragic 17.0% |
| Immigrants | Ireland | 1.4 /100 | #246 | Tragic 17.1% |
| Greeks | 1.3 /100 | #247 | Tragic 17.1% |
| Czechoslovakians | 1.3 /100 | #248 | Tragic 17.1% |
| Canadians | 1.3 /100 | #249 | Tragic 17.1% |
Demographics Similar to Latvians by Single Father Poverty
In terms of single father poverty, the demographic groups most similar to Latvians are Immigrants from Burma/Myanmar (16.5%, a difference of 0.050%), Russian (16.4%, a difference of 0.060%), Ukrainian (16.4%, a difference of 0.080%), Immigrants from Guyana (16.5%, a difference of 0.10%), and Immigrants from Venezuela (16.4%, a difference of 0.11%).
| Demographics | Rating | Rank | Single Father Poverty |
| Immigrants | Italy | 35.7 /100 | #182 | Fair 16.4% |
| Aleuts | 35.3 /100 | #183 | Fair 16.4% |
| Cambodians | 34.6 /100 | #184 | Fair 16.4% |
| Panamanians | 33.6 /100 | #185 | Fair 16.4% |
| Immigrants | Venezuela | 31.0 /100 | #186 | Fair 16.4% |
| Ukrainians | 30.4 /100 | #187 | Fair 16.4% |
| Russians | 30.1 /100 | #188 | Fair 16.4% |
| Latvians | 28.9 /100 | #189 | Fair 16.5% |
| Immigrants | Burma/Myanmar | 28.0 /100 | #190 | Fair 16.5% |
| Immigrants | Guyana | 27.1 /100 | #191 | Fair 16.5% |
| Immigrants | Switzerland | 24.8 /100 | #192 | Fair 16.5% |
| Ecuadorians | 24.5 /100 | #193 | Fair 16.5% |
| Cape Verdeans | 24.4 /100 | #194 | Fair 16.5% |
| Immigrants | Barbados | 24.3 /100 | #195 | Fair 16.5% |
| Immigrants | Canada | 21.9 /100 | #196 | Fair 16.5% |