Moroccan vs Immigrants from Sudan Male Poverty
COMPARE
Moroccan
Immigrants from Sudan
Male Poverty
Male Poverty Comparison
Moroccans
Immigrants from Sudan
12.0%
MALE POVERTY
4.2/ 100
METRIC RATING
210th/ 347
METRIC RANK
12.9%
MALE POVERTY
0.2/ 100
METRIC RATING
248th/ 347
METRIC RANK
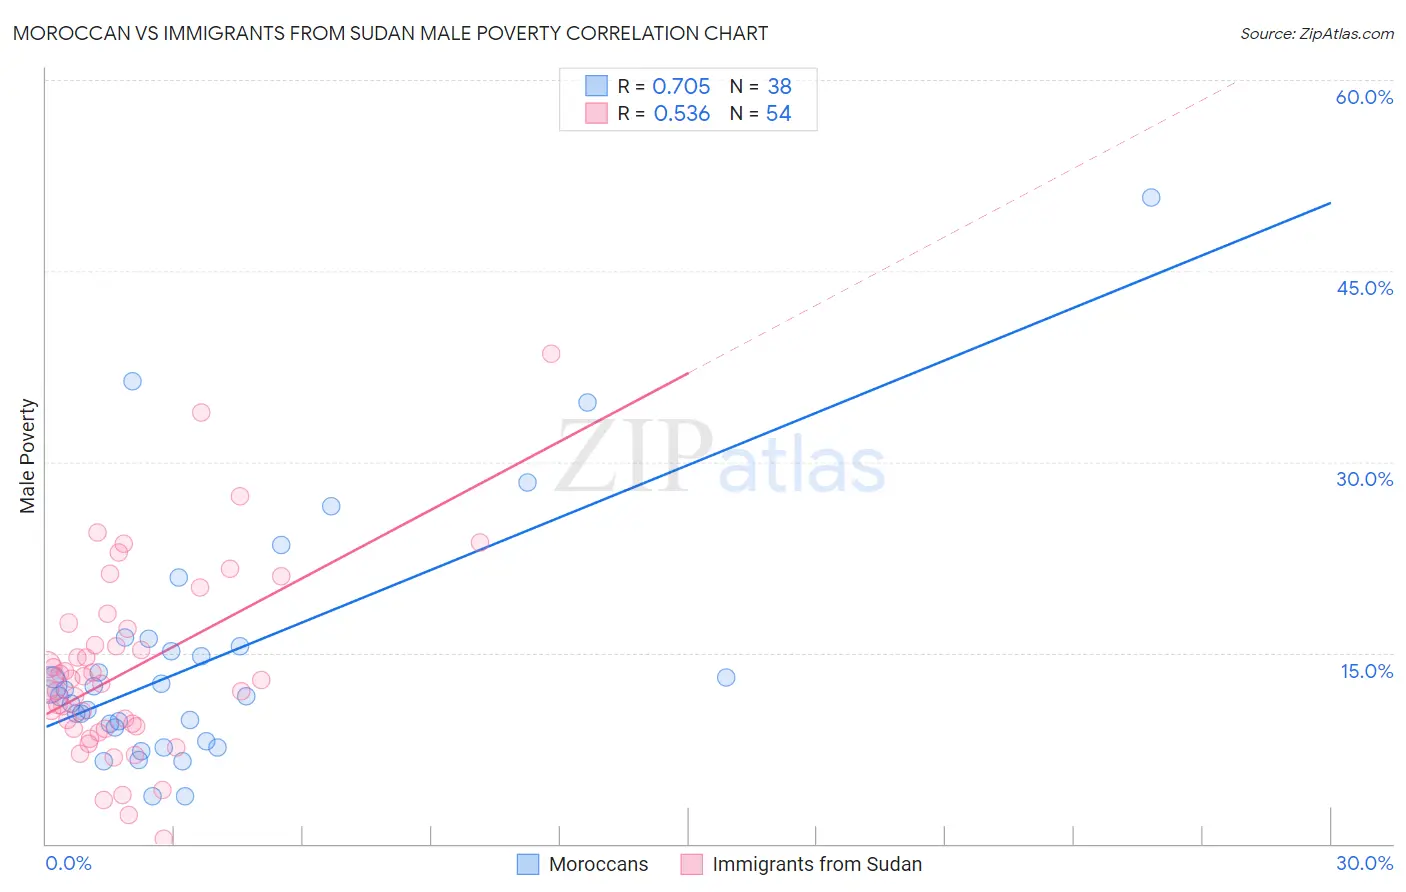
Moroccan vs Immigrants from Sudan Male Poverty Correlation Chart
The statistical analysis conducted on geographies consisting of 201,723,684 people shows a strong positive correlation between the proportion of Moroccans and poverty level among males in the United States with a correlation coefficient (R) of 0.705 and weighted average of 12.0%. Similarly, the statistical analysis conducted on geographies consisting of 118,946,491 people shows a substantial positive correlation between the proportion of Immigrants from Sudan and poverty level among males in the United States with a correlation coefficient (R) of 0.536 and weighted average of 12.9%, a difference of 7.1%.
Male Poverty Correlation Summary
| Measurement | Moroccan | Immigrants from Sudan |
| Minimum | 3.7% | 0.44% |
| Maximum | 50.7% | 38.5% |
| Range | 47.0% | 38.1% |
| Mean | 14.4% | 13.7% |
| Median | 11.8% | 12.7% |
| Interquartile 25% (IQ1) | 9.1% | 9.0% |
| Interquartile 75% (IQ3) | 15.5% | 16.9% |
| Interquartile Range (IQR) | 6.4% | 7.9% |
| Standard Deviation (Sample) | 9.7% | 7.4% |
| Standard Deviation (Population) | 9.6% | 7.3% |
Similar Demographics by Male Poverty
Demographics Similar to Moroccans by Male Poverty
In terms of male poverty, the demographic groups most similar to Moroccans are Immigrants from the Azores (12.0%, a difference of 0.050%), Immigrants from Panama (12.1%, a difference of 0.12%), Immigrants (12.0%, a difference of 0.17%), Malaysian (12.0%, a difference of 0.50%), and Immigrants from Eastern Africa (12.0%, a difference of 0.60%).
| Demographics | Rating | Rank | Male Poverty |
| Immigrants | Western Asia | 9.8 /100 | #203 | Tragic 11.8% |
| Immigrants | Uganda | 8.5 /100 | #204 | Tragic 11.8% |
| Panamanians | 6.2 /100 | #205 | Tragic 11.9% |
| Immigrants | Eastern Africa | 5.4 /100 | #206 | Tragic 12.0% |
| Malaysians | 5.2 /100 | #207 | Tragic 12.0% |
| Immigrants | Immigrants | 4.5 /100 | #208 | Tragic 12.0% |
| Immigrants | Azores | 4.3 /100 | #209 | Tragic 12.0% |
| Moroccans | 4.2 /100 | #210 | Tragic 12.0% |
| Immigrants | Panama | 4.0 /100 | #211 | Tragic 12.1% |
| Americans | 3.2 /100 | #212 | Tragic 12.1% |
| Immigrants | Nonimmigrants | 3.1 /100 | #213 | Tragic 12.1% |
| Japanese | 2.7 /100 | #214 | Tragic 12.2% |
| Immigrants | Uzbekistan | 2.6 /100 | #215 | Tragic 12.2% |
| Immigrants | Cambodia | 2.5 /100 | #216 | Tragic 12.2% |
| Immigrants | Thailand | 2.5 /100 | #217 | Tragic 12.2% |
Demographics Similar to Immigrants from Sudan by Male Poverty
In terms of male poverty, the demographic groups most similar to Immigrants from Sudan are Immigrants from Western Africa (12.9%, a difference of 0.060%), Potawatomi (12.9%, a difference of 0.070%), Immigrants from Nicaragua (12.9%, a difference of 0.080%), Immigrants from Cuba (12.9%, a difference of 0.18%), and Immigrants from Ecuador (12.9%, a difference of 0.21%).
| Demographics | Rating | Rank | Male Poverty |
| Sudanese | 0.3 /100 | #241 | Tragic 12.8% |
| Nepalese | 0.3 /100 | #242 | Tragic 12.8% |
| Alaskan Athabascans | 0.3 /100 | #243 | Tragic 12.8% |
| Tsimshian | 0.3 /100 | #244 | Tragic 12.8% |
| Liberians | 0.3 /100 | #245 | Tragic 12.8% |
| Immigrants | El Salvador | 0.2 /100 | #246 | Tragic 12.8% |
| Immigrants | Western Africa | 0.2 /100 | #247 | Tragic 12.9% |
| Immigrants | Sudan | 0.2 /100 | #248 | Tragic 12.9% |
| Potawatomi | 0.2 /100 | #249 | Tragic 12.9% |
| Immigrants | Nicaragua | 0.2 /100 | #250 | Tragic 12.9% |
| Immigrants | Cuba | 0.2 /100 | #251 | Tragic 12.9% |
| Immigrants | Ecuador | 0.2 /100 | #252 | Tragic 12.9% |
| Immigrants | Ghana | 0.2 /100 | #253 | Tragic 12.9% |
| Mexican American Indians | 0.1 /100 | #254 | Tragic 13.0% |
| Immigrants | Liberia | 0.1 /100 | #255 | Tragic 13.0% |