Moroccan vs Immigrants from Sudan Per Capita Income
COMPARE
Moroccan
Immigrants from Sudan
Per Capita Income
Per Capita Income Comparison
Moroccans
Immigrants from Sudan
$45,854
PER CAPITA INCOME
92.1/ 100
METRIC RATING
122nd/ 347
METRIC RANK
$41,986
PER CAPITA INCOME
13.2/ 100
METRIC RATING
209th/ 347
METRIC RANK
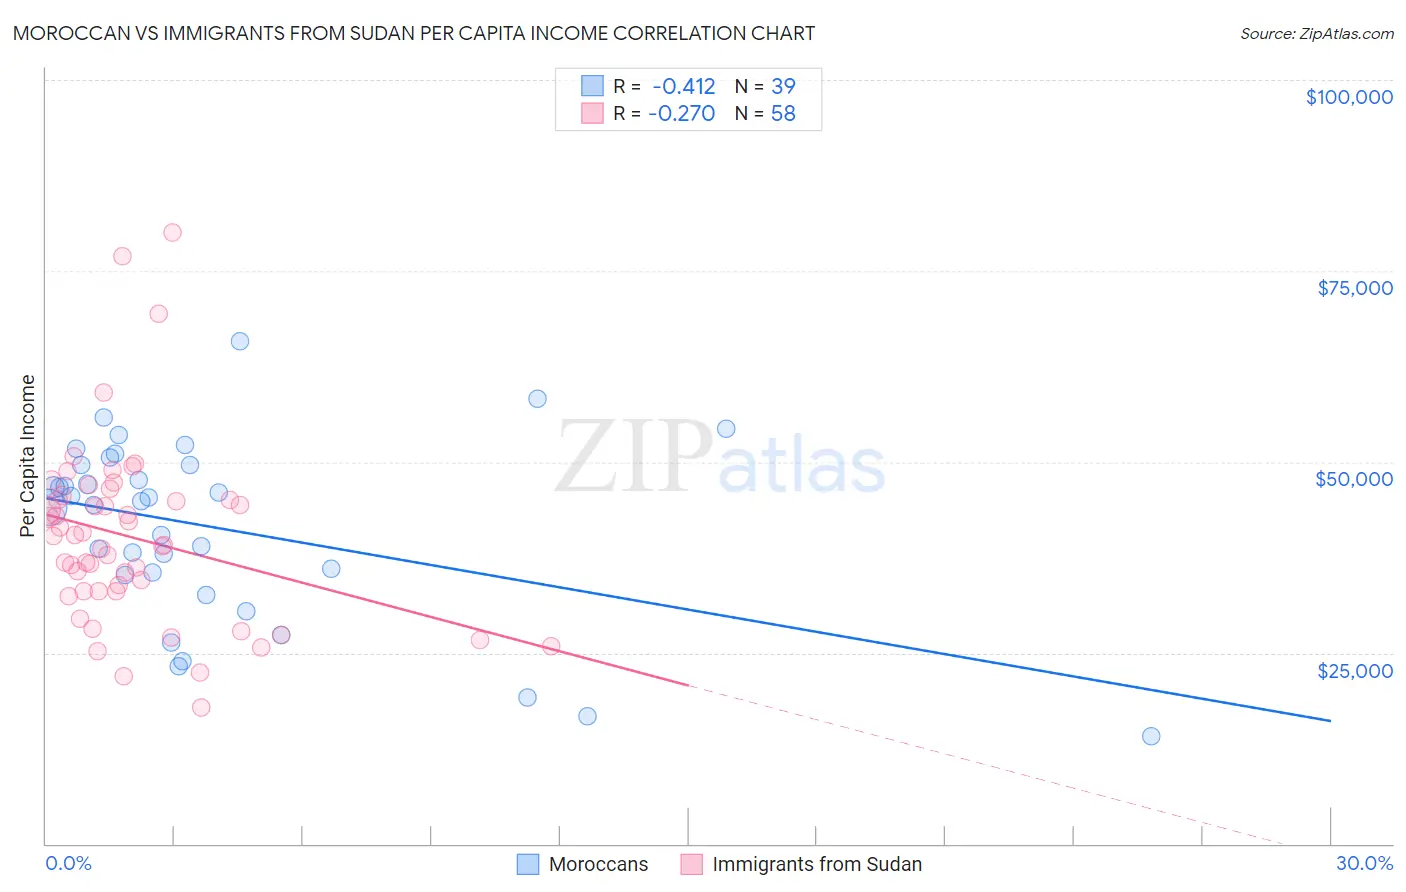
Moroccan vs Immigrants from Sudan Per Capita Income Correlation Chart
The statistical analysis conducted on geographies consisting of 201,819,214 people shows a moderate negative correlation between the proportion of Moroccans and per capita income in the United States with a correlation coefficient (R) of -0.412 and weighted average of $45,854. Similarly, the statistical analysis conducted on geographies consisting of 118,972,993 people shows a weak negative correlation between the proportion of Immigrants from Sudan and per capita income in the United States with a correlation coefficient (R) of -0.270 and weighted average of $41,986, a difference of 9.2%.
Per Capita Income Correlation Summary
| Measurement | Moroccan | Immigrants from Sudan |
| Minimum | $14,047 | $17,842 |
| Maximum | $65,725 | $80,005 |
| Range | $51,678 | $62,163 |
| Mean | $41,336 | $40,107 |
| Median | $44,873 | $39,743 |
| Interquartile 25% (IQ1) | $35,130 | $33,055 |
| Interquartile 75% (IQ3) | $49,634 | $45,054 |
| Interquartile Range (IQR) | $14,504 | $11,999 |
| Standard Deviation (Sample) | $11,952 | $11,901 |
| Standard Deviation (Population) | $11,797 | $11,798 |
Similar Demographics by Per Capita Income
Demographics Similar to Moroccans by Per Capita Income
In terms of per capita income, the demographic groups most similar to Moroccans are Canadian ($45,858, a difference of 0.010%), Lebanese ($45,840, a difference of 0.030%), European ($45,836, a difference of 0.040%), Zimbabwean ($45,804, a difference of 0.11%), and Palestinian ($45,790, a difference of 0.14%).
| Demographics | Rating | Rank | Per Capita Income |
| Immigrants | Chile | 94.6 /100 | #115 | Exceptional $46,213 |
| Poles | 94.1 /100 | #116 | Exceptional $46,123 |
| Chinese | 93.9 /100 | #117 | Exceptional $46,098 |
| Immigrants | Saudi Arabia | 93.3 /100 | #118 | Exceptional $46,008 |
| Immigrants | Poland | 93.1 /100 | #119 | Exceptional $45,979 |
| Immigrants | Ethiopia | 92.7 /100 | #120 | Exceptional $45,923 |
| Canadians | 92.2 /100 | #121 | Exceptional $45,858 |
| Moroccans | 92.1 /100 | #122 | Exceptional $45,854 |
| Lebanese | 92.0 /100 | #123 | Exceptional $45,840 |
| Europeans | 92.0 /100 | #124 | Exceptional $45,836 |
| Zimbabweans | 91.7 /100 | #125 | Exceptional $45,804 |
| Palestinians | 91.6 /100 | #126 | Exceptional $45,790 |
| Immigrants | Germany | 91.3 /100 | #127 | Exceptional $45,751 |
| Swedes | 91.3 /100 | #128 | Exceptional $45,750 |
| Luxembourgers | 90.4 /100 | #129 | Exceptional $45,663 |
Demographics Similar to Immigrants from Sudan by Per Capita Income
In terms of per capita income, the demographic groups most similar to Immigrants from Sudan are Ecuadorian ($41,958, a difference of 0.070%), Panamanian ($42,035, a difference of 0.12%), Venezuelan ($42,074, a difference of 0.21%), Immigrants from Panama ($41,853, a difference of 0.32%), and Immigrants from Senegal ($41,830, a difference of 0.37%).
| Demographics | Rating | Rank | Per Capita Income |
| Immigrants | Bosnia and Herzegovina | 17.5 /100 | #202 | Poor $42,278 |
| Spanish | 17.0 /100 | #203 | Poor $42,249 |
| Aleuts | 16.4 /100 | #204 | Poor $42,210 |
| Whites/Caucasians | 15.9 /100 | #205 | Poor $42,180 |
| Ghanaians | 15.7 /100 | #206 | Poor $42,164 |
| Venezuelans | 14.4 /100 | #207 | Poor $42,074 |
| Panamanians | 13.9 /100 | #208 | Poor $42,035 |
| Immigrants | Sudan | 13.2 /100 | #209 | Poor $41,986 |
| Ecuadorians | 12.9 /100 | #210 | Poor $41,958 |
| Immigrants | Panama | 11.6 /100 | #211 | Poor $41,853 |
| Immigrants | Senegal | 11.3 /100 | #212 | Poor $41,830 |
| Immigrants | Venezuela | 10.2 /100 | #213 | Poor $41,727 |
| Immigrants | Bangladesh | 10.1 /100 | #214 | Poor $41,709 |
| Sudanese | 9.9 /100 | #215 | Tragic $41,695 |
| Tongans | 9.9 /100 | #216 | Tragic $41,693 |