Moroccan vs Immigrants from Sudan Unemployment Among Ages 20 to 24 years
COMPARE
Moroccan
Immigrants from Sudan
Unemployment Among Ages 20 to 24 years
Unemployment Among Ages 20 to 24 years Comparison
Moroccans
Immigrants from Sudan
10.7%
UNEMPLOYMENT AMONG AGES 20 TO 24 YEARS
1.4/ 100
METRIC RATING
242nd/ 347
METRIC RANK
9.3%
UNEMPLOYMENT AMONG AGES 20 TO 24 YEARS
100.0/ 100
METRIC RATING
15th/ 347
METRIC RANK
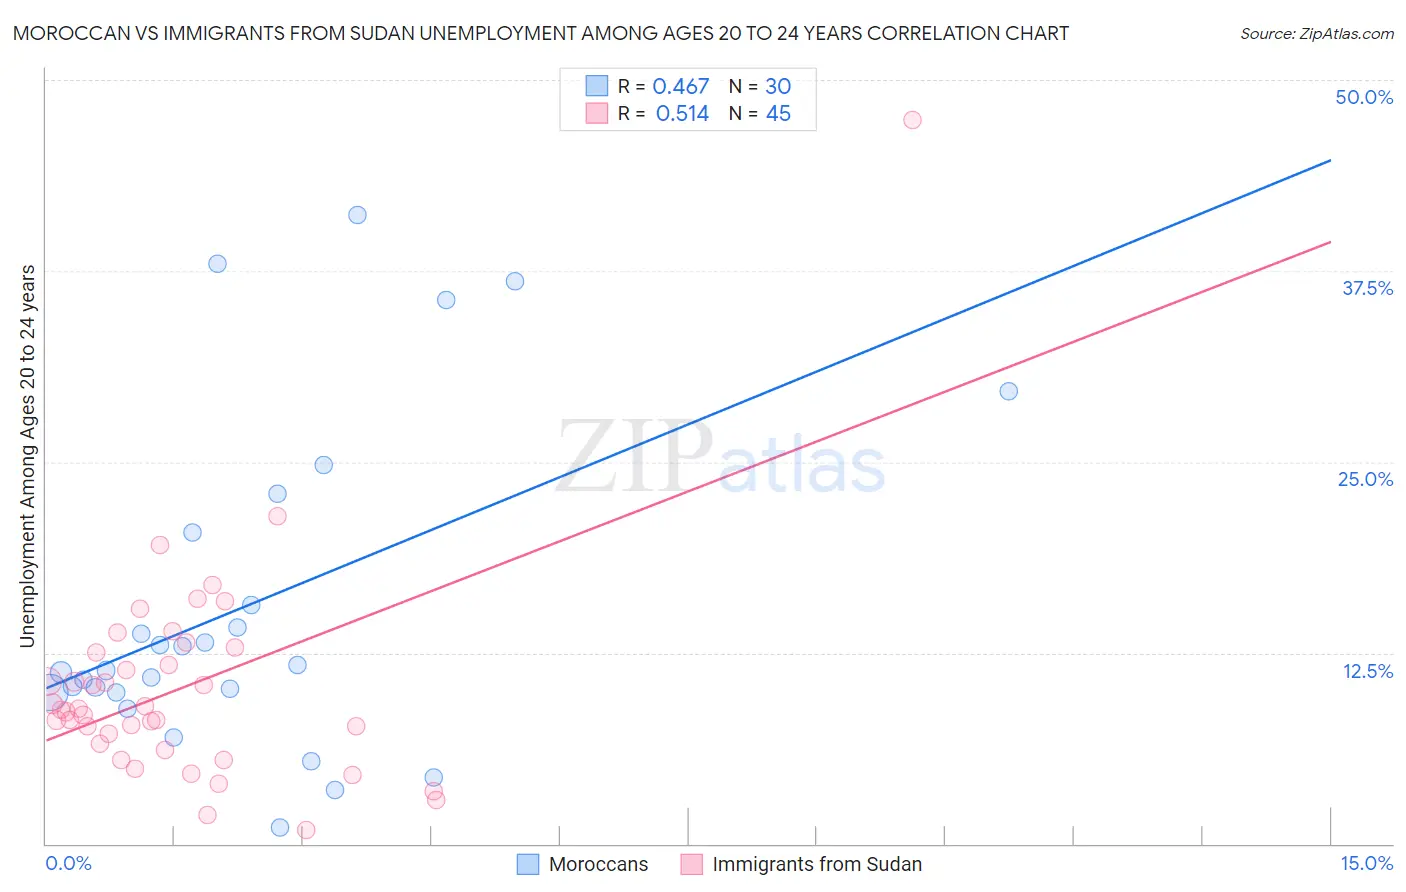
Moroccan vs Immigrants from Sudan Unemployment Among Ages 20 to 24 years Correlation Chart
The statistical analysis conducted on geographies consisting of 199,384,501 people shows a moderate positive correlation between the proportion of Moroccans and unemployment rate among population between the ages 20 and 24 in the United States with a correlation coefficient (R) of 0.467 and weighted average of 10.7%. Similarly, the statistical analysis conducted on geographies consisting of 118,369,819 people shows a substantial positive correlation between the proportion of Immigrants from Sudan and unemployment rate among population between the ages 20 and 24 in the United States with a correlation coefficient (R) of 0.514 and weighted average of 9.3%, a difference of 15.6%.
Unemployment Among Ages 20 to 24 years Correlation Summary
| Measurement | Moroccan | Immigrants from Sudan |
| Minimum | 1.1% | 0.90% |
| Maximum | 41.2% | 47.4% |
| Range | 40.1% | 46.5% |
| Mean | 15.6% | 10.2% |
| Median | 11.5% | 8.8% |
| Interquartile 25% (IQ1) | 9.9% | 6.4% |
| Interquartile 75% (IQ3) | 20.4% | 12.7% |
| Interquartile Range (IQR) | 10.5% | 6.3% |
| Standard Deviation (Sample) | 10.7% | 7.2% |
| Standard Deviation (Population) | 10.6% | 7.2% |
Similar Demographics by Unemployment Among Ages 20 to 24 years
Demographics Similar to Moroccans by Unemployment Among Ages 20 to 24 years
In terms of unemployment among ages 20 to 24 years, the demographic groups most similar to Moroccans are Immigrants from Belarus (10.7%, a difference of 0.040%), Immigrants from Mexico (10.7%, a difference of 0.10%), Immigrants from El Salvador (10.7%, a difference of 0.17%), Hispanic or Latino (10.7%, a difference of 0.29%), and Immigrants from Central America (10.7%, a difference of 0.31%).
| Demographics | Rating | Rank | Unemployment Among Ages 20 to 24 years |
| Immigrants | Ukraine | 3.3 /100 | #235 | Tragic 10.6% |
| Mexicans | 3.2 /100 | #236 | Tragic 10.6% |
| Immigrants | Immigrants | 2.7 /100 | #237 | Tragic 10.6% |
| Immigrants | Pakistan | 2.6 /100 | #238 | Tragic 10.6% |
| Salvadorans | 2.4 /100 | #239 | Tragic 10.7% |
| Immigrants | Central America | 2.0 /100 | #240 | Tragic 10.7% |
| Immigrants | El Salvador | 1.7 /100 | #241 | Tragic 10.7% |
| Moroccans | 1.4 /100 | #242 | Tragic 10.7% |
| Immigrants | Belarus | 1.3 /100 | #243 | Tragic 10.7% |
| Immigrants | Mexico | 1.2 /100 | #244 | Tragic 10.7% |
| Hispanics or Latinos | 1.0 /100 | #245 | Tragic 10.7% |
| Immigrants | Iran | 0.9 /100 | #246 | Tragic 10.8% |
| Immigrants | Albania | 0.7 /100 | #247 | Tragic 10.8% |
| Cree | 0.6 /100 | #248 | Tragic 10.8% |
| South American Indians | 0.5 /100 | #249 | Tragic 10.8% |
Demographics Similar to Immigrants from Sudan by Unemployment Among Ages 20 to 24 years
In terms of unemployment among ages 20 to 24 years, the demographic groups most similar to Immigrants from Sudan are Slovene (9.3%, a difference of 0.030%), Danish (9.3%, a difference of 0.16%), Immigrants from Congo (9.2%, a difference of 0.41%), Cuban (9.2%, a difference of 0.49%), and Zimbabwean (9.2%, a difference of 0.60%).
| Demographics | Rating | Rank | Unemployment Among Ages 20 to 24 years |
| Somalis | 100.0 /100 | #8 | Exceptional 9.1% |
| Immigrants | Somalia | 100.0 /100 | #9 | Exceptional 9.2% |
| Sudanese | 100.0 /100 | #10 | Exceptional 9.2% |
| Zimbabweans | 100.0 /100 | #11 | Exceptional 9.2% |
| Cubans | 100.0 /100 | #12 | Exceptional 9.2% |
| Immigrants | Congo | 100.0 /100 | #13 | Exceptional 9.2% |
| Slovenes | 100.0 /100 | #14 | Exceptional 9.3% |
| Immigrants | Sudan | 100.0 /100 | #15 | Exceptional 9.3% |
| Danes | 100.0 /100 | #16 | Exceptional 9.3% |
| Czechs | 100.0 /100 | #17 | Exceptional 9.3% |
| Chinese | 100.0 /100 | #18 | Exceptional 9.4% |
| Hmong | 100.0 /100 | #19 | Exceptional 9.4% |
| Osage | 100.0 /100 | #20 | Exceptional 9.4% |
| Immigrants | Bosnia and Herzegovina | 100.0 /100 | #21 | Exceptional 9.4% |
| Tongans | 100.0 /100 | #22 | Exceptional 9.4% |