Moroccan vs Cree Single Father Poverty
COMPARE
Moroccan
Cree
Single Father Poverty
Single Father Poverty Comparison
Moroccans
Cree
17.0%
SINGLE FATHER POVERTY
2.1/ 100
METRIC RATING
242nd/ 347
METRIC RANK
17.1%
SINGLE FATHER POVERTY
1.0/ 100
METRIC RATING
253rd/ 347
METRIC RANK
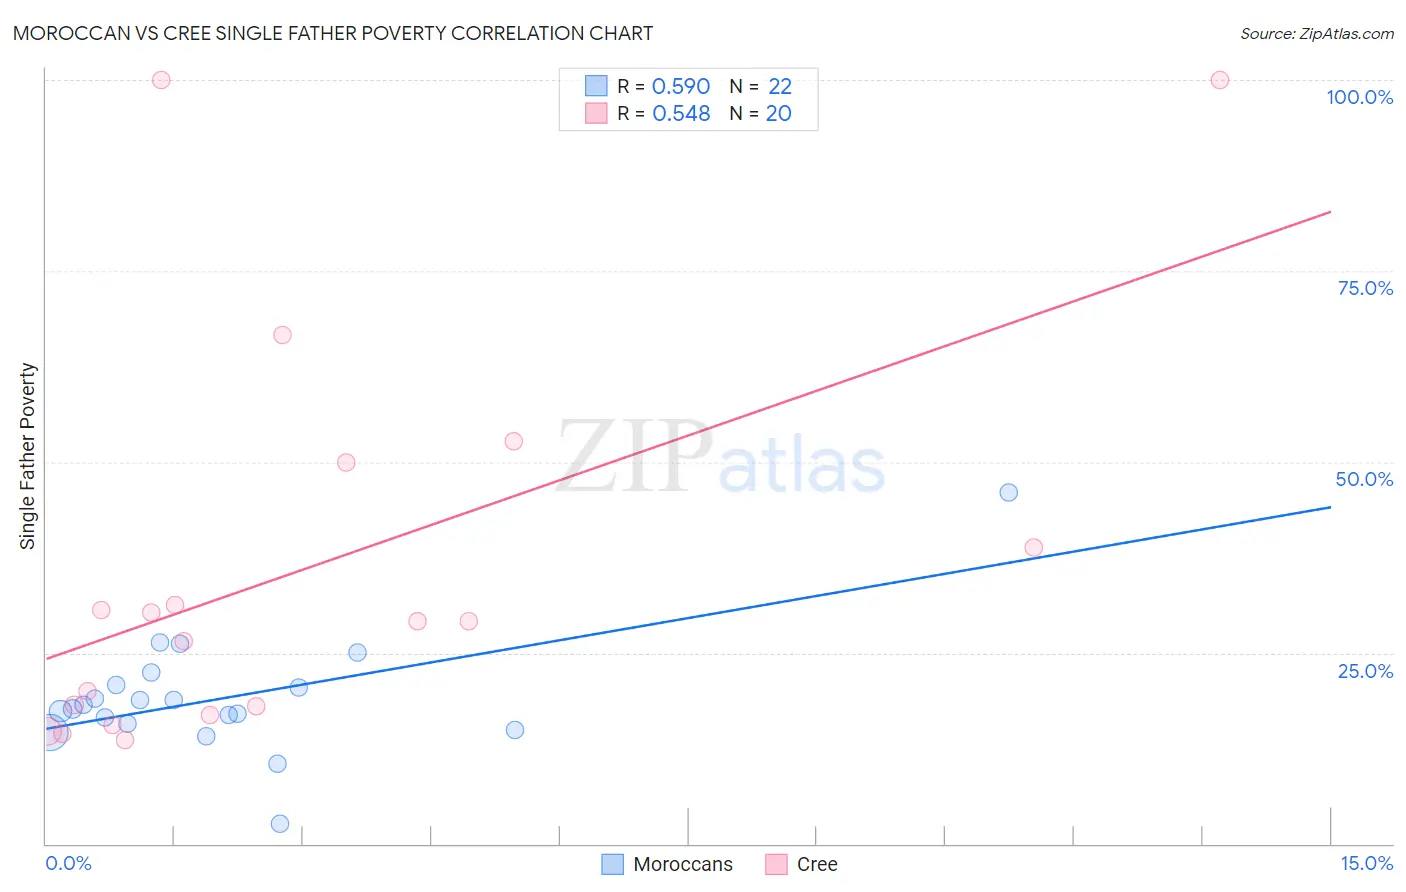
Moroccan vs Cree Single Father Poverty Correlation Chart
The statistical analysis conducted on geographies consisting of 173,540,722 people shows a substantial positive correlation between the proportion of Moroccans and poverty level among single fathers in the United States with a correlation coefficient (R) of 0.590 and weighted average of 17.0%. Similarly, the statistical analysis conducted on geographies consisting of 70,905,004 people shows a substantial positive correlation between the proportion of Cree and poverty level among single fathers in the United States with a correlation coefficient (R) of 0.548 and weighted average of 17.1%, a difference of 0.81%.
Single Father Poverty Correlation Summary
| Measurement | Moroccan | Cree |
| Minimum | 2.6% | 13.5% |
| Maximum | 46.0% | 100.0% |
| Range | 43.4% | 86.5% |
| Mean | 19.1% | 35.8% |
| Median | 17.9% | 29.2% |
| Interquartile 25% (IQ1) | 15.7% | 17.4% |
| Interquartile 75% (IQ3) | 20.7% | 44.4% |
| Interquartile Range (IQR) | 5.0% | 26.9% |
| Standard Deviation (Sample) | 7.9% | 26.1% |
| Standard Deviation (Population) | 7.7% | 25.5% |
Demographics Similar to Moroccans and Cree by Single Father Poverty
In terms of single father poverty, the demographic groups most similar to Moroccans are Czech (17.0%, a difference of 0.10%), Finnish (16.9%, a difference of 0.22%), Bermudan (16.9%, a difference of 0.23%), Immigrants from Saudi Arabia (16.9%, a difference of 0.25%), and Subsaharan African (16.9%, a difference of 0.32%). Similarly, the demographic groups most similar to Cree are Croatian (17.1%, a difference of 0.010%), Austrian (17.1%, a difference of 0.11%), Luxembourger (17.1%, a difference of 0.11%), Immigrants from Honduras (17.1%, a difference of 0.12%), and Canadian (17.1%, a difference of 0.25%).
| Demographics | Rating | Rank | Single Father Poverty |
| Sub-Saharan Africans | 2.9 /100 | #237 | Tragic 16.9% |
| Immigrants | Saudi Arabia | 2.7 /100 | #238 | Tragic 16.9% |
| Bermudans | 2.6 /100 | #239 | Tragic 16.9% |
| Finns | 2.6 /100 | #240 | Tragic 16.9% |
| Czechs | 2.3 /100 | #241 | Tragic 17.0% |
| Moroccans | 2.1 /100 | #242 | Tragic 17.0% |
| Immigrants | Cabo Verde | 1.6 /100 | #243 | Tragic 17.0% |
| Hondurans | 1.6 /100 | #244 | Tragic 17.0% |
| Trinidadians and Tobagonians | 1.5 /100 | #245 | Tragic 17.0% |
| Immigrants | Ireland | 1.4 /100 | #246 | Tragic 17.1% |
| Greeks | 1.3 /100 | #247 | Tragic 17.1% |
| Czechoslovakians | 1.3 /100 | #248 | Tragic 17.1% |
| Canadians | 1.3 /100 | #249 | Tragic 17.1% |
| Austrians | 1.1 /100 | #250 | Tragic 17.1% |
| Luxembourgers | 1.1 /100 | #251 | Tragic 17.1% |
| Croatians | 1.0 /100 | #252 | Tragic 17.1% |
| Cree | 1.0 /100 | #253 | Tragic 17.1% |
| Immigrants | Honduras | 0.9 /100 | #254 | Tragic 17.1% |
| Sierra Leoneans | 0.8 /100 | #255 | Tragic 17.2% |
| Immigrants | Haiti | 0.8 /100 | #256 | Tragic 17.2% |
| Immigrants | Albania | 0.7 /100 | #257 | Tragic 17.2% |