Moroccan vs Immigrants from Poland Single Father Poverty
COMPARE
Moroccan
Immigrants from Poland
Single Father Poverty
Single Father Poverty Comparison
Moroccans
Immigrants from Poland
17.0%
SINGLE FATHER POVERTY
2.1/ 100
METRIC RATING
242nd/ 347
METRIC RANK
15.7%
SINGLE FATHER POVERTY
95.8/ 100
METRIC RATING
106th/ 347
METRIC RANK
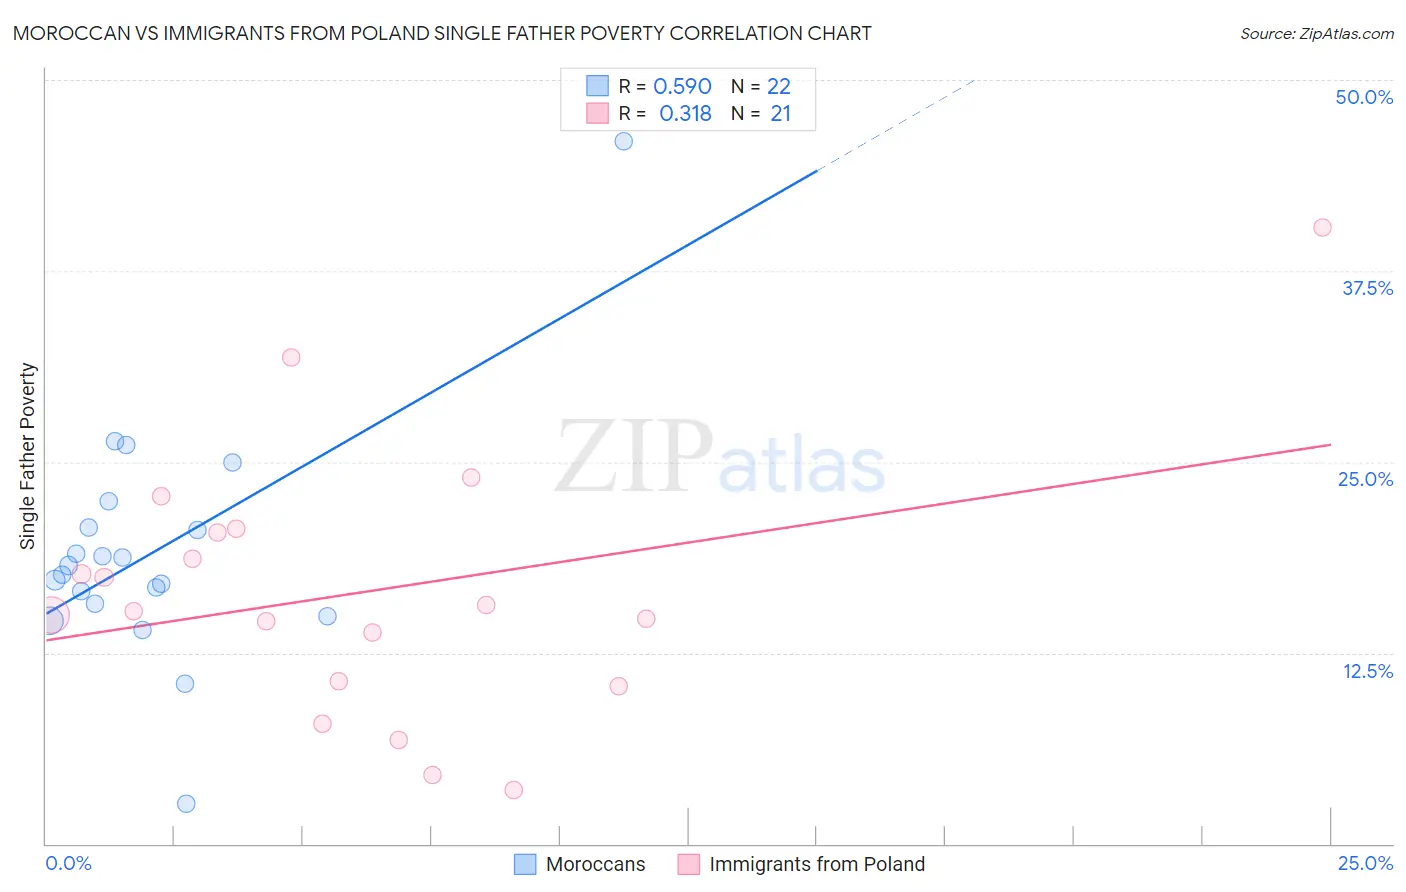
Moroccan vs Immigrants from Poland Single Father Poverty Correlation Chart
The statistical analysis conducted on geographies consisting of 173,540,722 people shows a substantial positive correlation between the proportion of Moroccans and poverty level among single fathers in the United States with a correlation coefficient (R) of 0.590 and weighted average of 17.0%. Similarly, the statistical analysis conducted on geographies consisting of 239,246,300 people shows a mild positive correlation between the proportion of Immigrants from Poland and poverty level among single fathers in the United States with a correlation coefficient (R) of 0.318 and weighted average of 15.7%, a difference of 8.0%.
Single Father Poverty Correlation Summary
| Measurement | Moroccan | Immigrants from Poland |
| Minimum | 2.6% | 3.5% |
| Maximum | 46.0% | 40.3% |
| Range | 43.4% | 36.8% |
| Mean | 19.1% | 16.5% |
| Median | 17.9% | 15.2% |
| Interquartile 25% (IQ1) | 15.7% | 10.5% |
| Interquartile 75% (IQ3) | 20.7% | 20.5% |
| Interquartile Range (IQR) | 5.0% | 10.0% |
| Standard Deviation (Sample) | 7.9% | 8.7% |
| Standard Deviation (Population) | 7.7% | 8.5% |
Similar Demographics by Single Father Poverty
Demographics Similar to Moroccans by Single Father Poverty
In terms of single father poverty, the demographic groups most similar to Moroccans are Czech (17.0%, a difference of 0.10%), Finnish (16.9%, a difference of 0.22%), Bermudan (16.9%, a difference of 0.23%), Immigrants from Saudi Arabia (16.9%, a difference of 0.25%), and Subsaharan African (16.9%, a difference of 0.32%).
| Demographics | Rating | Rank | Single Father Poverty |
| Immigrants | Western Europe | 2.9 /100 | #235 | Tragic 16.9% |
| Immigrants | Germany | 2.9 /100 | #236 | Tragic 16.9% |
| Sub-Saharan Africans | 2.9 /100 | #237 | Tragic 16.9% |
| Immigrants | Saudi Arabia | 2.7 /100 | #238 | Tragic 16.9% |
| Bermudans | 2.6 /100 | #239 | Tragic 16.9% |
| Finns | 2.6 /100 | #240 | Tragic 16.9% |
| Czechs | 2.3 /100 | #241 | Tragic 17.0% |
| Moroccans | 2.1 /100 | #242 | Tragic 17.0% |
| Immigrants | Cabo Verde | 1.6 /100 | #243 | Tragic 17.0% |
| Hondurans | 1.6 /100 | #244 | Tragic 17.0% |
| Trinidadians and Tobagonians | 1.5 /100 | #245 | Tragic 17.0% |
| Immigrants | Ireland | 1.4 /100 | #246 | Tragic 17.1% |
| Greeks | 1.3 /100 | #247 | Tragic 17.1% |
| Czechoslovakians | 1.3 /100 | #248 | Tragic 17.1% |
| Canadians | 1.3 /100 | #249 | Tragic 17.1% |
Demographics Similar to Immigrants from Poland by Single Father Poverty
In terms of single father poverty, the demographic groups most similar to Immigrants from Poland are Native Hawaiian (15.7%, a difference of 0.020%), Pakistani (15.7%, a difference of 0.030%), Immigrants from Australia (15.7%, a difference of 0.070%), Australian (15.7%, a difference of 0.080%), and South American Indian (15.7%, a difference of 0.11%).
| Demographics | Rating | Rank | Single Father Poverty |
| Immigrants | Middle Africa | 97.4 /100 | #99 | Exceptional 15.6% |
| Immigrants | Chile | 96.9 /100 | #100 | Exceptional 15.7% |
| Fijians | 96.8 /100 | #101 | Exceptional 15.7% |
| Chileans | 96.4 /100 | #102 | Exceptional 15.7% |
| South American Indians | 96.2 /100 | #103 | Exceptional 15.7% |
| Australians | 96.1 /100 | #104 | Exceptional 15.7% |
| Immigrants | Australia | 96.1 /100 | #105 | Exceptional 15.7% |
| Immigrants | Poland | 95.8 /100 | #106 | Exceptional 15.7% |
| Native Hawaiians | 95.8 /100 | #107 | Exceptional 15.7% |
| Pakistanis | 95.7 /100 | #108 | Exceptional 15.7% |
| Turks | 95.1 /100 | #109 | Exceptional 15.8% |
| Immigrants | Africa | 95.1 /100 | #110 | Exceptional 15.8% |
| Bulgarians | 94.8 /100 | #111 | Exceptional 15.8% |
| Immigrants | Latvia | 94.7 /100 | #112 | Exceptional 15.8% |
| Danes | 94.5 /100 | #113 | Exceptional 15.8% |