Potawatomi vs Immigrants from Sudan Single Father Poverty
COMPARE
Potawatomi
Immigrants from Sudan
Single Father Poverty
Single Father Poverty Comparison
Potawatomi
Immigrants from Sudan
18.9%
SINGLE FATHER POVERTY
0.0/ 100
METRIC RATING
313th/ 347
METRIC RANK
16.2%
SINGLE FATHER POVERTY
59.8/ 100
METRIC RATING
160th/ 347
METRIC RANK
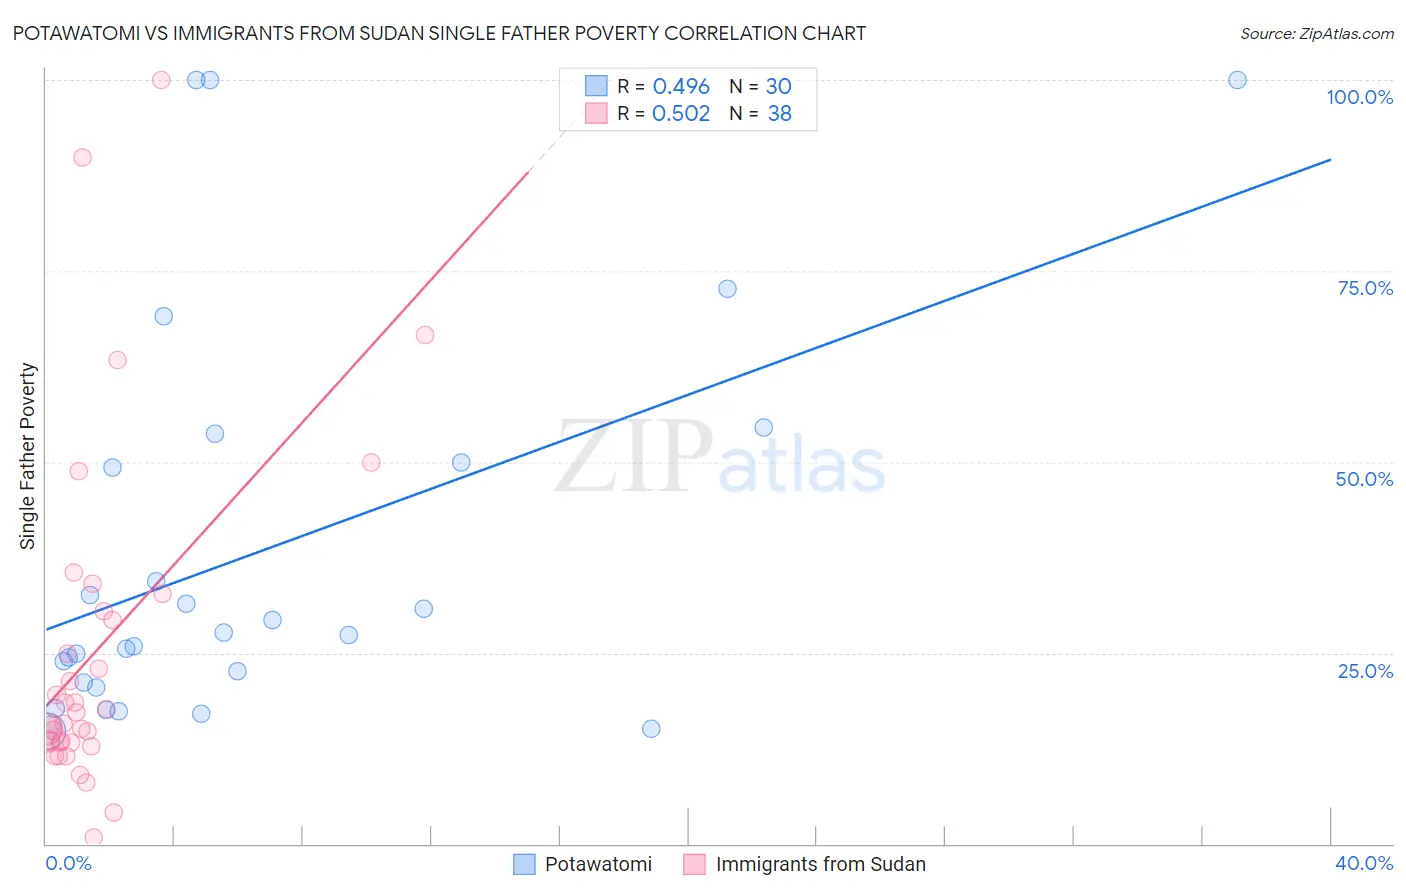
Potawatomi vs Immigrants from Sudan Single Father Poverty Correlation Chart
The statistical analysis conducted on geographies consisting of 106,133,326 people shows a moderate positive correlation between the proportion of Potawatomi and poverty level among single fathers in the United States with a correlation coefficient (R) of 0.496 and weighted average of 18.9%. Similarly, the statistical analysis conducted on geographies consisting of 108,710,355 people shows a substantial positive correlation between the proportion of Immigrants from Sudan and poverty level among single fathers in the United States with a correlation coefficient (R) of 0.502 and weighted average of 16.2%, a difference of 16.5%.
Single Father Poverty Correlation Summary
| Measurement | Potawatomi | Immigrants from Sudan |
| Minimum | 14.8% | 0.76% |
| Maximum | 100.0% | 100.0% |
| Range | 85.2% | 99.2% |
| Mean | 38.4% | 25.5% |
| Median | 27.5% | 16.4% |
| Interquartile 25% (IQ1) | 21.1% | 13.3% |
| Interquartile 75% (IQ3) | 50.0% | 30.5% |
| Interquartile Range (IQR) | 28.9% | 17.2% |
| Standard Deviation (Sample) | 25.8% | 22.2% |
| Standard Deviation (Population) | 25.4% | 21.9% |
Similar Demographics by Single Father Poverty
Demographics Similar to Potawatomi by Single Father Poverty
In terms of single father poverty, the demographic groups most similar to Potawatomi are Delaware (18.9%, a difference of 0.16%), Immigrants from Dominica (18.9%, a difference of 0.20%), Nonimmigrants (18.8%, a difference of 0.25%), Chickasaw (19.0%, a difference of 0.32%), and Chippewa (18.8%, a difference of 0.44%).
| Demographics | Rating | Rank | Single Father Poverty |
| Scotch-Irish | 0.0 /100 | #306 | Tragic 18.6% |
| French Canadians | 0.0 /100 | #307 | Tragic 18.6% |
| Ottawa | 0.0 /100 | #308 | Tragic 18.6% |
| Immigrants | Micronesia | 0.0 /100 | #309 | Tragic 18.6% |
| Chippewa | 0.0 /100 | #310 | Tragic 18.8% |
| Immigrants | Nonimmigrants | 0.0 /100 | #311 | Tragic 18.8% |
| Immigrants | Dominica | 0.0 /100 | #312 | Tragic 18.9% |
| Potawatomi | 0.0 /100 | #313 | Tragic 18.9% |
| Delaware | 0.0 /100 | #314 | Tragic 18.9% |
| Chickasaw | 0.0 /100 | #315 | Tragic 19.0% |
| Osage | 0.0 /100 | #316 | Tragic 19.0% |
| Dominicans | 0.0 /100 | #317 | Tragic 19.1% |
| Dutch West Indians | 0.0 /100 | #318 | Tragic 19.2% |
| Slovaks | 0.0 /100 | #319 | Tragic 19.3% |
| Inupiat | 0.0 /100 | #320 | Tragic 19.5% |
Demographics Similar to Immigrants from Sudan by Single Father Poverty
In terms of single father poverty, the demographic groups most similar to Immigrants from Sudan are Belizean (16.2%, a difference of 0.010%), Portuguese (16.2%, a difference of 0.12%), Immigrants from Czechoslovakia (16.2%, a difference of 0.14%), Estonian (16.2%, a difference of 0.14%), and Ugandan (16.3%, a difference of 0.18%).
| Demographics | Rating | Rank | Single Father Poverty |
| Immigrants | Israel | 72.0 /100 | #153 | Good 16.1% |
| Mexicans | 70.1 /100 | #154 | Good 16.1% |
| Immigrants | Nicaragua | 67.8 /100 | #155 | Good 16.2% |
| Immigrants | Jordan | 66.0 /100 | #156 | Good 16.2% |
| Immigrants | Czechoslovakia | 62.8 /100 | #157 | Good 16.2% |
| Portuguese | 62.3 /100 | #158 | Good 16.2% |
| Belizeans | 59.9 /100 | #159 | Average 16.2% |
| Immigrants | Sudan | 59.8 /100 | #160 | Average 16.2% |
| Estonians | 56.7 /100 | #161 | Average 16.2% |
| Ugandans | 55.9 /100 | #162 | Average 16.3% |
| Immigrants | Costa Rica | 55.7 /100 | #163 | Average 16.3% |
| Guyanese | 55.2 /100 | #164 | Average 16.3% |
| Immigrants | Bangladesh | 55.1 /100 | #165 | Average 16.3% |
| Immigrants | Europe | 54.8 /100 | #166 | Average 16.3% |
| Yugoslavians | 53.9 /100 | #167 | Average 16.3% |