German vs Immigrants from Sudan Single Father Poverty
COMPARE
German
Immigrants from Sudan
Single Father Poverty
Single Father Poverty Comparison
Germans
Immigrants from Sudan
17.7%
SINGLE FATHER POVERTY
0.0/ 100
METRIC RATING
278th/ 347
METRIC RANK
16.2%
SINGLE FATHER POVERTY
59.8/ 100
METRIC RATING
160th/ 347
METRIC RANK
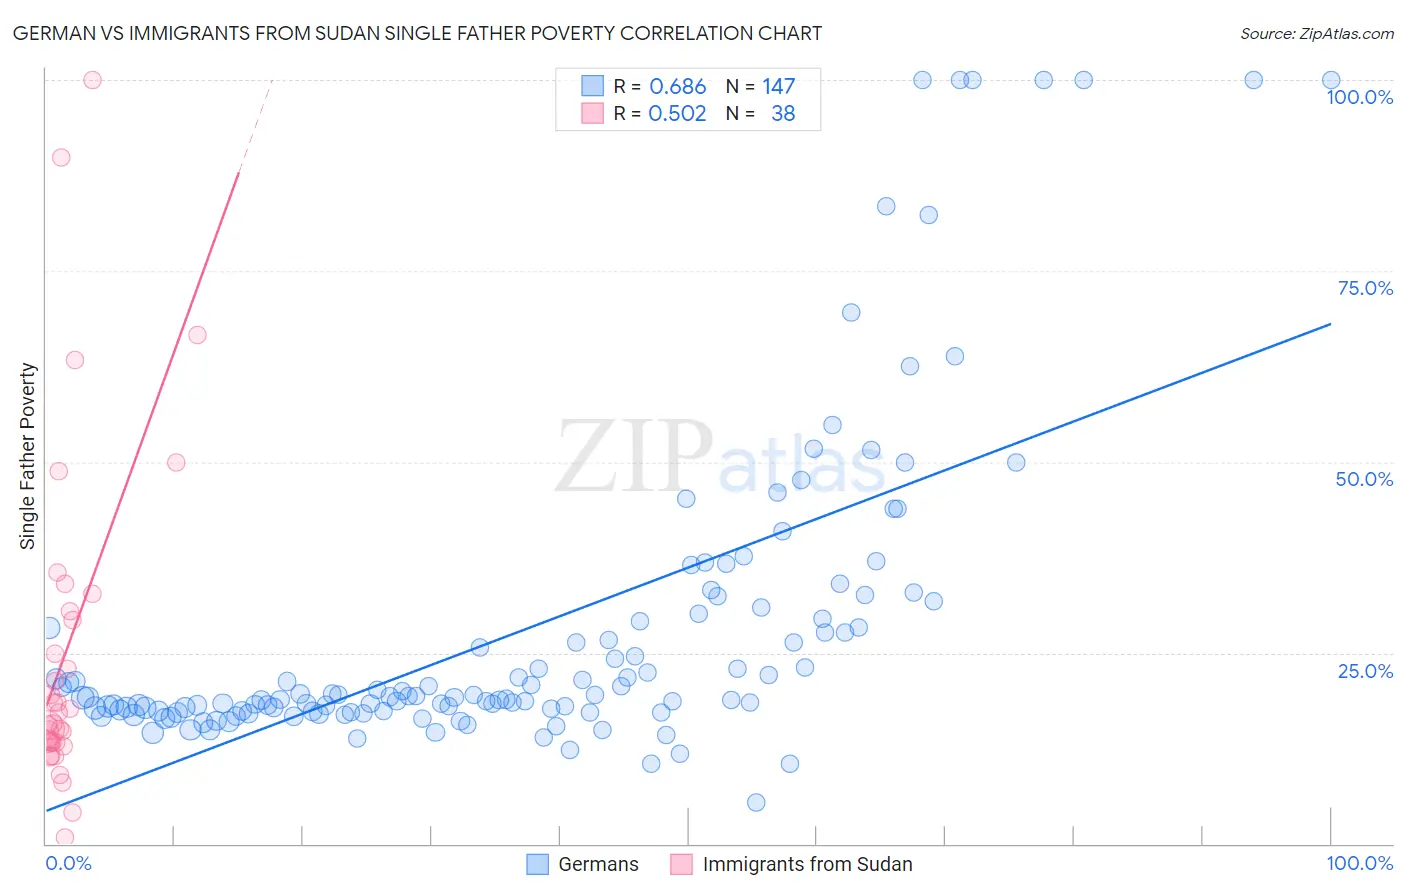
German vs Immigrants from Sudan Single Father Poverty Correlation Chart
The statistical analysis conducted on geographies consisting of 412,171,316 people shows a significant positive correlation between the proportion of Germans and poverty level among single fathers in the United States with a correlation coefficient (R) of 0.686 and weighted average of 17.7%. Similarly, the statistical analysis conducted on geographies consisting of 108,710,355 people shows a substantial positive correlation between the proportion of Immigrants from Sudan and poverty level among single fathers in the United States with a correlation coefficient (R) of 0.502 and weighted average of 16.2%, a difference of 9.2%.
Single Father Poverty Correlation Summary
| Measurement | German | Immigrants from Sudan |
| Minimum | 5.4% | 0.76% |
| Maximum | 100.0% | 100.0% |
| Range | 94.6% | 99.2% |
| Mean | 28.0% | 25.5% |
| Median | 19.2% | 16.4% |
| Interquartile 25% (IQ1) | 17.4% | 13.3% |
| Interquartile 75% (IQ3) | 29.5% | 30.5% |
| Interquartile Range (IQR) | 12.1% | 17.2% |
| Standard Deviation (Sample) | 20.7% | 22.2% |
| Standard Deviation (Population) | 20.6% | 21.9% |
Similar Demographics by Single Father Poverty
Demographics Similar to Germans by Single Father Poverty
In terms of single father poverty, the demographic groups most similar to Germans are Lebanese (17.7%, a difference of 0.010%), Iroquois (17.7%, a difference of 0.15%), German Russian (17.7%, a difference of 0.16%), Scottish (17.7%, a difference of 0.19%), and British West Indian (17.7%, a difference of 0.22%).
| Demographics | Rating | Rank | Single Father Poverty |
| French American Indians | 0.2 /100 | #271 | Tragic 17.4% |
| Barbadians | 0.1 /100 | #272 | Tragic 17.5% |
| Italians | 0.1 /100 | #273 | Tragic 17.5% |
| Macedonians | 0.1 /100 | #274 | Tragic 17.7% |
| British West Indians | 0.0 /100 | #275 | Tragic 17.7% |
| German Russians | 0.0 /100 | #276 | Tragic 17.7% |
| Lebanese | 0.0 /100 | #277 | Tragic 17.7% |
| Germans | 0.0 /100 | #278 | Tragic 17.7% |
| Iroquois | 0.0 /100 | #279 | Tragic 17.7% |
| Scottish | 0.0 /100 | #280 | Tragic 17.7% |
| English | 0.0 /100 | #281 | Tragic 17.8% |
| Dutch | 0.0 /100 | #282 | Tragic 17.8% |
| Alsatians | 0.0 /100 | #283 | Tragic 17.8% |
| Welsh | 0.0 /100 | #284 | Tragic 17.8% |
| Immigrants | Lebanon | 0.0 /100 | #285 | Tragic 17.9% |
Demographics Similar to Immigrants from Sudan by Single Father Poverty
In terms of single father poverty, the demographic groups most similar to Immigrants from Sudan are Belizean (16.2%, a difference of 0.010%), Portuguese (16.2%, a difference of 0.12%), Immigrants from Czechoslovakia (16.2%, a difference of 0.14%), Estonian (16.2%, a difference of 0.14%), and Ugandan (16.3%, a difference of 0.18%).
| Demographics | Rating | Rank | Single Father Poverty |
| Immigrants | Israel | 72.0 /100 | #153 | Good 16.1% |
| Mexicans | 70.1 /100 | #154 | Good 16.1% |
| Immigrants | Nicaragua | 67.8 /100 | #155 | Good 16.2% |
| Immigrants | Jordan | 66.0 /100 | #156 | Good 16.2% |
| Immigrants | Czechoslovakia | 62.8 /100 | #157 | Good 16.2% |
| Portuguese | 62.3 /100 | #158 | Good 16.2% |
| Belizeans | 59.9 /100 | #159 | Average 16.2% |
| Immigrants | Sudan | 59.8 /100 | #160 | Average 16.2% |
| Estonians | 56.7 /100 | #161 | Average 16.2% |
| Ugandans | 55.9 /100 | #162 | Average 16.3% |
| Immigrants | Costa Rica | 55.7 /100 | #163 | Average 16.3% |
| Guyanese | 55.2 /100 | #164 | Average 16.3% |
| Immigrants | Bangladesh | 55.1 /100 | #165 | Average 16.3% |
| Immigrants | Europe | 54.8 /100 | #166 | Average 16.3% |
| Yugoslavians | 53.9 /100 | #167 | Average 16.3% |