Uruguayan vs Immigrants from Sudan Single Father Poverty
COMPARE
Uruguayan
Immigrants from Sudan
Single Father Poverty
Single Father Poverty Comparison
Uruguayans
Immigrants from Sudan
15.9%
SINGLE FATHER POVERTY
92.1/ 100
METRIC RATING
120th/ 347
METRIC RANK
16.2%
SINGLE FATHER POVERTY
59.8/ 100
METRIC RATING
160th/ 347
METRIC RANK
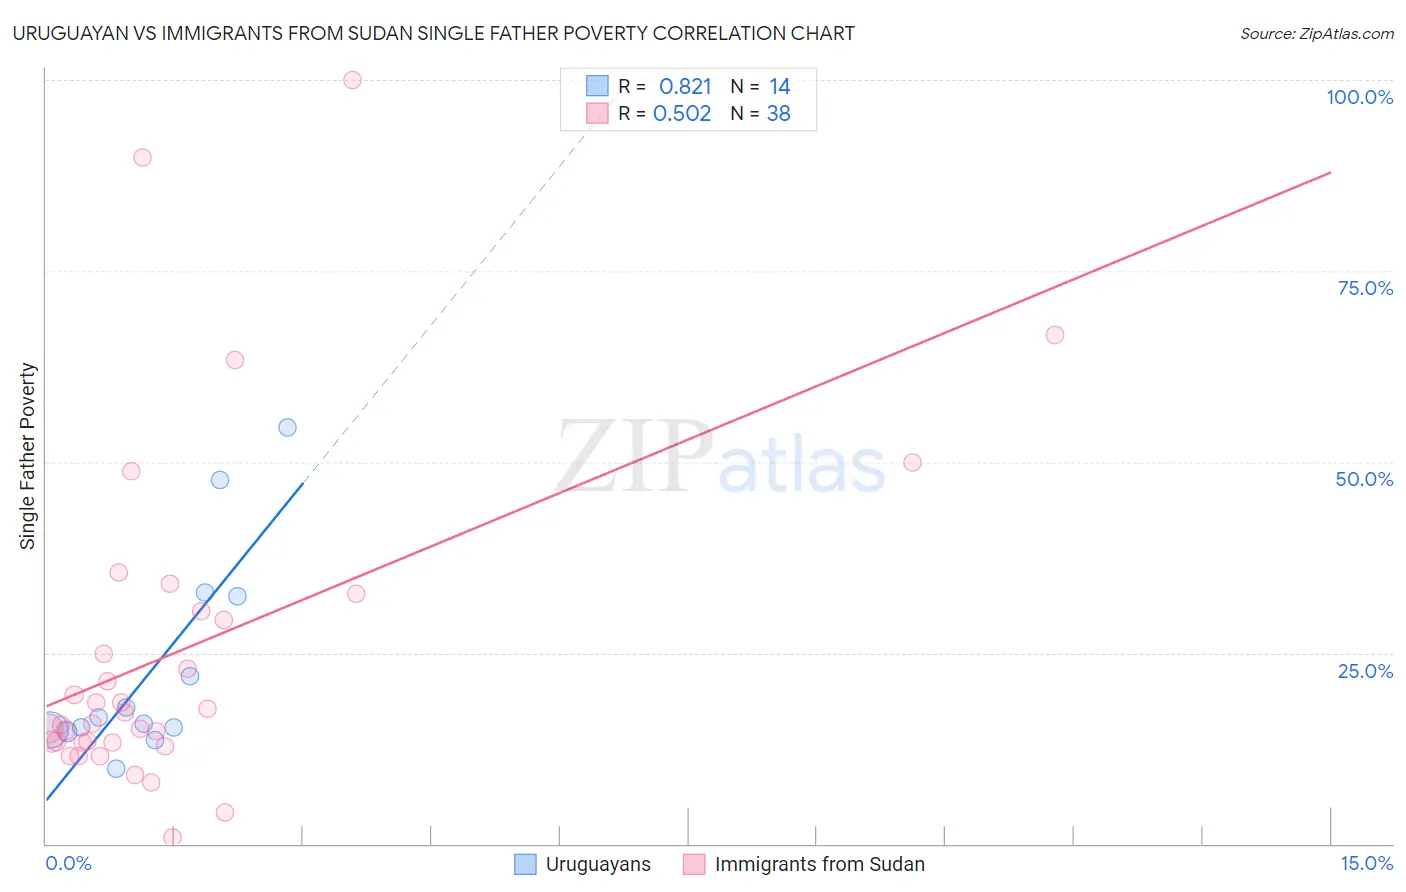
Uruguayan vs Immigrants from Sudan Single Father Poverty Correlation Chart
The statistical analysis conducted on geographies consisting of 126,833,155 people shows a very strong positive correlation between the proportion of Uruguayans and poverty level among single fathers in the United States with a correlation coefficient (R) of 0.821 and weighted average of 15.9%. Similarly, the statistical analysis conducted on geographies consisting of 108,710,355 people shows a substantial positive correlation between the proportion of Immigrants from Sudan and poverty level among single fathers in the United States with a correlation coefficient (R) of 0.502 and weighted average of 16.2%, a difference of 2.3%.
Single Father Poverty Correlation Summary
| Measurement | Uruguayan | Immigrants from Sudan |
| Minimum | 9.8% | 0.76% |
| Maximum | 54.5% | 100.0% |
| Range | 44.7% | 99.2% |
| Mean | 23.1% | 25.5% |
| Median | 16.1% | 16.4% |
| Interquartile 25% (IQ1) | 15.0% | 13.3% |
| Interquartile 75% (IQ3) | 32.4% | 30.5% |
| Interquartile Range (IQR) | 17.4% | 17.2% |
| Standard Deviation (Sample) | 13.7% | 22.2% |
| Standard Deviation (Population) | 13.2% | 21.9% |
Similar Demographics by Single Father Poverty
Demographics Similar to Uruguayans by Single Father Poverty
In terms of single father poverty, the demographic groups most similar to Uruguayans are Immigrants (15.9%, a difference of 0.020%), Immigrants from Belarus (15.8%, a difference of 0.060%), Immigrants from Eastern Europe (15.8%, a difference of 0.070%), Sudanese (15.9%, a difference of 0.080%), and Immigrants from Colombia (15.8%, a difference of 0.090%).
| Demographics | Rating | Rank | Single Father Poverty |
| Danes | 94.5 /100 | #113 | Exceptional 15.8% |
| Argentineans | 94.4 /100 | #114 | Exceptional 15.8% |
| Immigrants | Thailand | 93.6 /100 | #115 | Exceptional 15.8% |
| Immigrants | Argentina | 92.8 /100 | #116 | Exceptional 15.8% |
| Immigrants | Colombia | 92.6 /100 | #117 | Exceptional 15.8% |
| Immigrants | Eastern Europe | 92.5 /100 | #118 | Exceptional 15.8% |
| Immigrants | Belarus | 92.4 /100 | #119 | Exceptional 15.8% |
| Uruguayans | 92.1 /100 | #120 | Exceptional 15.9% |
| Immigrants | Immigrants | 91.9 /100 | #121 | Exceptional 15.9% |
| Sudanese | 91.6 /100 | #122 | Exceptional 15.9% |
| Palestinians | 91.3 /100 | #123 | Exceptional 15.9% |
| Immigrants | Panama | 91.3 /100 | #124 | Exceptional 15.9% |
| Iraqis | 91.2 /100 | #125 | Exceptional 15.9% |
| Hmong | 91.1 /100 | #126 | Exceptional 15.9% |
| Immigrants | Liberia | 91.1 /100 | #127 | Exceptional 15.9% |
Demographics Similar to Immigrants from Sudan by Single Father Poverty
In terms of single father poverty, the demographic groups most similar to Immigrants from Sudan are Belizean (16.2%, a difference of 0.010%), Portuguese (16.2%, a difference of 0.12%), Immigrants from Czechoslovakia (16.2%, a difference of 0.14%), Estonian (16.2%, a difference of 0.14%), and Ugandan (16.3%, a difference of 0.18%).
| Demographics | Rating | Rank | Single Father Poverty |
| Immigrants | Israel | 72.0 /100 | #153 | Good 16.1% |
| Mexicans | 70.1 /100 | #154 | Good 16.1% |
| Immigrants | Nicaragua | 67.8 /100 | #155 | Good 16.2% |
| Immigrants | Jordan | 66.0 /100 | #156 | Good 16.2% |
| Immigrants | Czechoslovakia | 62.8 /100 | #157 | Good 16.2% |
| Portuguese | 62.3 /100 | #158 | Good 16.2% |
| Belizeans | 59.9 /100 | #159 | Average 16.2% |
| Immigrants | Sudan | 59.8 /100 | #160 | Average 16.2% |
| Estonians | 56.7 /100 | #161 | Average 16.2% |
| Ugandans | 55.9 /100 | #162 | Average 16.3% |
| Immigrants | Costa Rica | 55.7 /100 | #163 | Average 16.3% |
| Guyanese | 55.2 /100 | #164 | Average 16.3% |
| Immigrants | Bangladesh | 55.1 /100 | #165 | Average 16.3% |
| Immigrants | Europe | 54.8 /100 | #166 | Average 16.3% |
| Yugoslavians | 53.9 /100 | #167 | Average 16.3% |