Thai vs Immigrants from Switzerland Single Father Poverty
COMPARE
Thai
Immigrants from Switzerland
Single Father Poverty
Single Father Poverty Comparison
Thais
Immigrants from Switzerland
14.5%
SINGLE FATHER POVERTY
100.0/ 100
METRIC RATING
30th/ 347
METRIC RANK
16.5%
SINGLE FATHER POVERTY
24.8/ 100
METRIC RATING
192nd/ 347
METRIC RANK
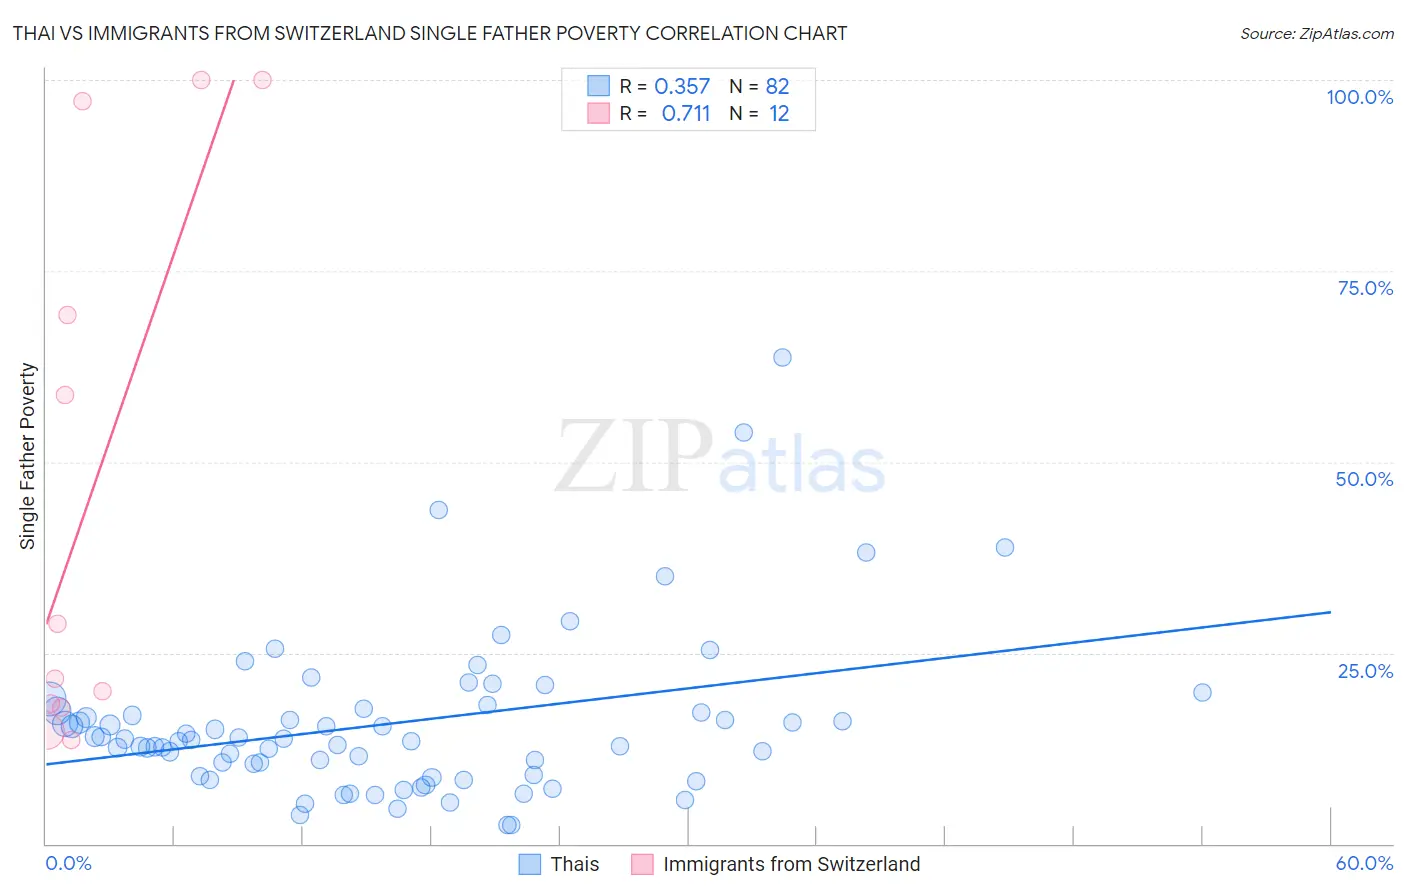
Thai vs Immigrants from Switzerland Single Father Poverty Correlation Chart
The statistical analysis conducted on geographies consisting of 363,511,447 people shows a mild positive correlation between the proportion of Thais and poverty level among single fathers in the United States with a correlation coefficient (R) of 0.357 and weighted average of 14.5%. Similarly, the statistical analysis conducted on geographies consisting of 124,581,780 people shows a strong positive correlation between the proportion of Immigrants from Switzerland and poverty level among single fathers in the United States with a correlation coefficient (R) of 0.711 and weighted average of 16.5%, a difference of 13.6%.
Single Father Poverty Correlation Summary
| Measurement | Thai | Immigrants from Switzerland |
| Minimum | 2.5% | 13.7% |
| Maximum | 63.6% | 100.0% |
| Range | 61.2% | 86.3% |
| Mean | 15.7% | 46.7% |
| Median | 13.6% | 25.2% |
| Interquartile 25% (IQ1) | 9.0% | 18.1% |
| Interquartile 75% (IQ3) | 17.4% | 83.2% |
| Interquartile Range (IQR) | 8.4% | 65.1% |
| Standard Deviation (Sample) | 10.5% | 36.1% |
| Standard Deviation (Population) | 10.4% | 34.5% |
Similar Demographics by Single Father Poverty
Demographics Similar to Thais by Single Father Poverty
In terms of single father poverty, the demographic groups most similar to Thais are Somali (14.5%, a difference of 0.040%), Icelander (14.5%, a difference of 0.080%), Immigrants from South Central Asia (14.5%, a difference of 0.15%), Asian (14.6%, a difference of 0.24%), and Nepalese (14.4%, a difference of 0.68%).
| Demographics | Rating | Rank | Single Father Poverty |
| Immigrants | Egypt | 100.0 /100 | #23 | Exceptional 14.4% |
| Immigrants | South Eastern Asia | 100.0 /100 | #24 | Exceptional 14.4% |
| Iranians | 100.0 /100 | #25 | Exceptional 14.4% |
| Spanish American Indians | 100.0 /100 | #26 | Exceptional 14.4% |
| Nepalese | 100.0 /100 | #27 | Exceptional 14.4% |
| Immigrants | South Central Asia | 100.0 /100 | #28 | Exceptional 14.5% |
| Somalis | 100.0 /100 | #29 | Exceptional 14.5% |
| Thais | 100.0 /100 | #30 | Exceptional 14.5% |
| Icelanders | 100.0 /100 | #31 | Exceptional 14.5% |
| Asians | 100.0 /100 | #32 | Exceptional 14.6% |
| Okinawans | 100.0 /100 | #33 | Exceptional 14.6% |
| Egyptians | 100.0 /100 | #34 | Exceptional 14.7% |
| Immigrants | Bolivia | 100.0 /100 | #35 | Exceptional 14.7% |
| Immigrants | Indonesia | 100.0 /100 | #36 | Exceptional 14.7% |
| Immigrants | Eastern Africa | 100.0 /100 | #37 | Exceptional 14.7% |
Demographics Similar to Immigrants from Switzerland by Single Father Poverty
In terms of single father poverty, the demographic groups most similar to Immigrants from Switzerland are Ecuadorian (16.5%, a difference of 0.010%), Cape Verdean (16.5%, a difference of 0.020%), Immigrants from Barbados (16.5%, a difference of 0.030%), Immigrants from Guyana (16.5%, a difference of 0.13%), and Immigrants from Canada (16.5%, a difference of 0.17%).
| Demographics | Rating | Rank | Single Father Poverty |
| Panamanians | 33.6 /100 | #185 | Fair 16.4% |
| Immigrants | Venezuela | 31.0 /100 | #186 | Fair 16.4% |
| Ukrainians | 30.4 /100 | #187 | Fair 16.4% |
| Russians | 30.1 /100 | #188 | Fair 16.4% |
| Latvians | 28.9 /100 | #189 | Fair 16.5% |
| Immigrants | Burma/Myanmar | 28.0 /100 | #190 | Fair 16.5% |
| Immigrants | Guyana | 27.1 /100 | #191 | Fair 16.5% |
| Immigrants | Switzerland | 24.8 /100 | #192 | Fair 16.5% |
| Ecuadorians | 24.5 /100 | #193 | Fair 16.5% |
| Cape Verdeans | 24.4 /100 | #194 | Fair 16.5% |
| Immigrants | Barbados | 24.3 /100 | #195 | Fair 16.5% |
| Immigrants | Canada | 21.9 /100 | #196 | Fair 16.5% |
| Immigrants | Northern Europe | 20.3 /100 | #197 | Fair 16.5% |
| Romanians | 20.1 /100 | #198 | Fair 16.5% |
| Immigrants | Belize | 19.8 /100 | #199 | Poor 16.5% |