Celtic vs Immigrants from Switzerland Single Father Poverty
COMPARE
Celtic
Immigrants from Switzerland
Single Father Poverty
Single Father Poverty Comparison
Celtics
Immigrants from Switzerland
18.5%
SINGLE FATHER POVERTY
0.0/ 100
METRIC RATING
303rd/ 347
METRIC RANK
16.5%
SINGLE FATHER POVERTY
24.8/ 100
METRIC RATING
192nd/ 347
METRIC RANK
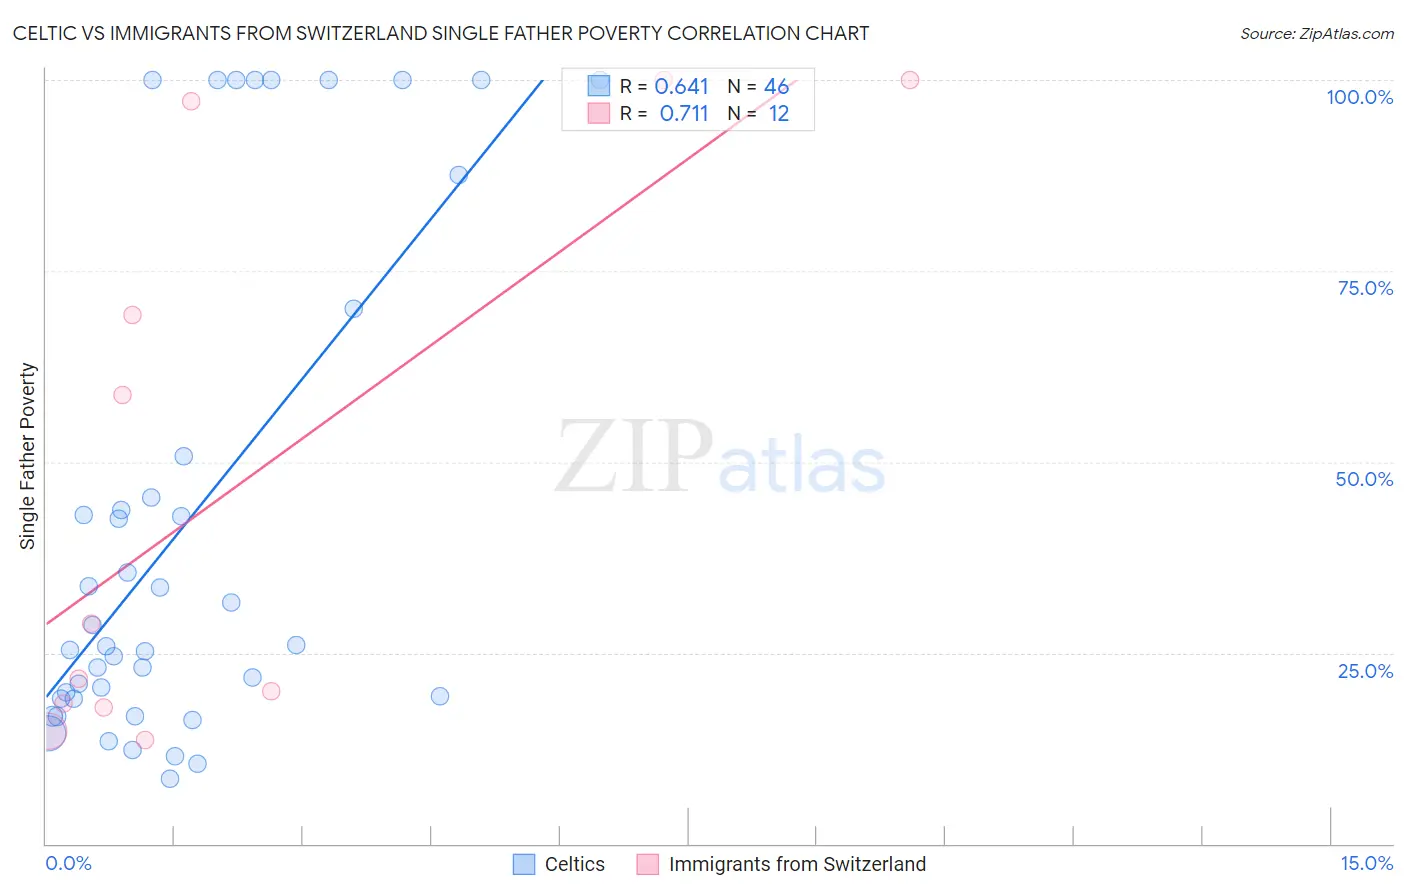
Celtic vs Immigrants from Switzerland Single Father Poverty Correlation Chart
The statistical analysis conducted on geographies consisting of 145,202,349 people shows a significant positive correlation between the proportion of Celtics and poverty level among single fathers in the United States with a correlation coefficient (R) of 0.641 and weighted average of 18.5%. Similarly, the statistical analysis conducted on geographies consisting of 124,581,780 people shows a strong positive correlation between the proportion of Immigrants from Switzerland and poverty level among single fathers in the United States with a correlation coefficient (R) of 0.711 and weighted average of 16.5%, a difference of 12.0%.
Single Father Poverty Correlation Summary
| Measurement | Celtic | Immigrants from Switzerland |
| Minimum | 8.4% | 13.7% |
| Maximum | 100.0% | 100.0% |
| Range | 91.6% | 86.3% |
| Mean | 42.2% | 46.7% |
| Median | 26.0% | 25.2% |
| Interquartile 25% (IQ1) | 19.0% | 18.1% |
| Interquartile 75% (IQ3) | 50.8% | 83.2% |
| Interquartile Range (IQR) | 31.8% | 65.1% |
| Standard Deviation (Sample) | 32.4% | 36.1% |
| Standard Deviation (Population) | 32.1% | 34.5% |
Similar Demographics by Single Father Poverty
Demographics Similar to Celtics by Single Father Poverty
In terms of single father poverty, the demographic groups most similar to Celtics are Comanche (18.5%, a difference of 0.040%), Ute (18.5%, a difference of 0.14%), Hungarian (18.5%, a difference of 0.15%), Blackfeet (18.5%, a difference of 0.19%), and Immigrants from Dominican Republic (18.4%, a difference of 0.37%).
| Demographics | Rating | Rank | Single Father Poverty |
| Seminole | 0.0 /100 | #296 | Tragic 18.1% |
| French | 0.0 /100 | #297 | Tragic 18.2% |
| Africans | 0.0 /100 | #298 | Tragic 18.3% |
| Whites/Caucasians | 0.0 /100 | #299 | Tragic 18.4% |
| Immigrants | Dominican Republic | 0.0 /100 | #300 | Tragic 18.4% |
| Hungarians | 0.0 /100 | #301 | Tragic 18.5% |
| Comanche | 0.0 /100 | #302 | Tragic 18.5% |
| Celtics | 0.0 /100 | #303 | Tragic 18.5% |
| Ute | 0.0 /100 | #304 | Tragic 18.5% |
| Blackfeet | 0.0 /100 | #305 | Tragic 18.5% |
| Scotch-Irish | 0.0 /100 | #306 | Tragic 18.6% |
| French Canadians | 0.0 /100 | #307 | Tragic 18.6% |
| Ottawa | 0.0 /100 | #308 | Tragic 18.6% |
| Immigrants | Micronesia | 0.0 /100 | #309 | Tragic 18.6% |
| Chippewa | 0.0 /100 | #310 | Tragic 18.8% |
Demographics Similar to Immigrants from Switzerland by Single Father Poverty
In terms of single father poverty, the demographic groups most similar to Immigrants from Switzerland are Ecuadorian (16.5%, a difference of 0.010%), Cape Verdean (16.5%, a difference of 0.020%), Immigrants from Barbados (16.5%, a difference of 0.030%), Immigrants from Guyana (16.5%, a difference of 0.13%), and Immigrants from Canada (16.5%, a difference of 0.17%).
| Demographics | Rating | Rank | Single Father Poverty |
| Panamanians | 33.6 /100 | #185 | Fair 16.4% |
| Immigrants | Venezuela | 31.0 /100 | #186 | Fair 16.4% |
| Ukrainians | 30.4 /100 | #187 | Fair 16.4% |
| Russians | 30.1 /100 | #188 | Fair 16.4% |
| Latvians | 28.9 /100 | #189 | Fair 16.5% |
| Immigrants | Burma/Myanmar | 28.0 /100 | #190 | Fair 16.5% |
| Immigrants | Guyana | 27.1 /100 | #191 | Fair 16.5% |
| Immigrants | Switzerland | 24.8 /100 | #192 | Fair 16.5% |
| Ecuadorians | 24.5 /100 | #193 | Fair 16.5% |
| Cape Verdeans | 24.4 /100 | #194 | Fair 16.5% |
| Immigrants | Barbados | 24.3 /100 | #195 | Fair 16.5% |
| Immigrants | Canada | 21.9 /100 | #196 | Fair 16.5% |
| Immigrants | Northern Europe | 20.3 /100 | #197 | Fair 16.5% |
| Romanians | 20.1 /100 | #198 | Fair 16.5% |
| Immigrants | Belize | 19.8 /100 | #199 | Poor 16.5% |