Kiowa vs Immigrants from Italy Single Father Poverty
COMPARE
Kiowa
Immigrants from Italy
Single Father Poverty
Single Father Poverty Comparison
Kiowa
Immigrants from Italy
22.5%
SINGLE FATHER POVERTY
0.0/ 100
METRIC RATING
334th/ 347
METRIC RANK
16.4%
SINGLE FATHER POVERTY
35.7/ 100
METRIC RATING
182nd/ 347
METRIC RANK
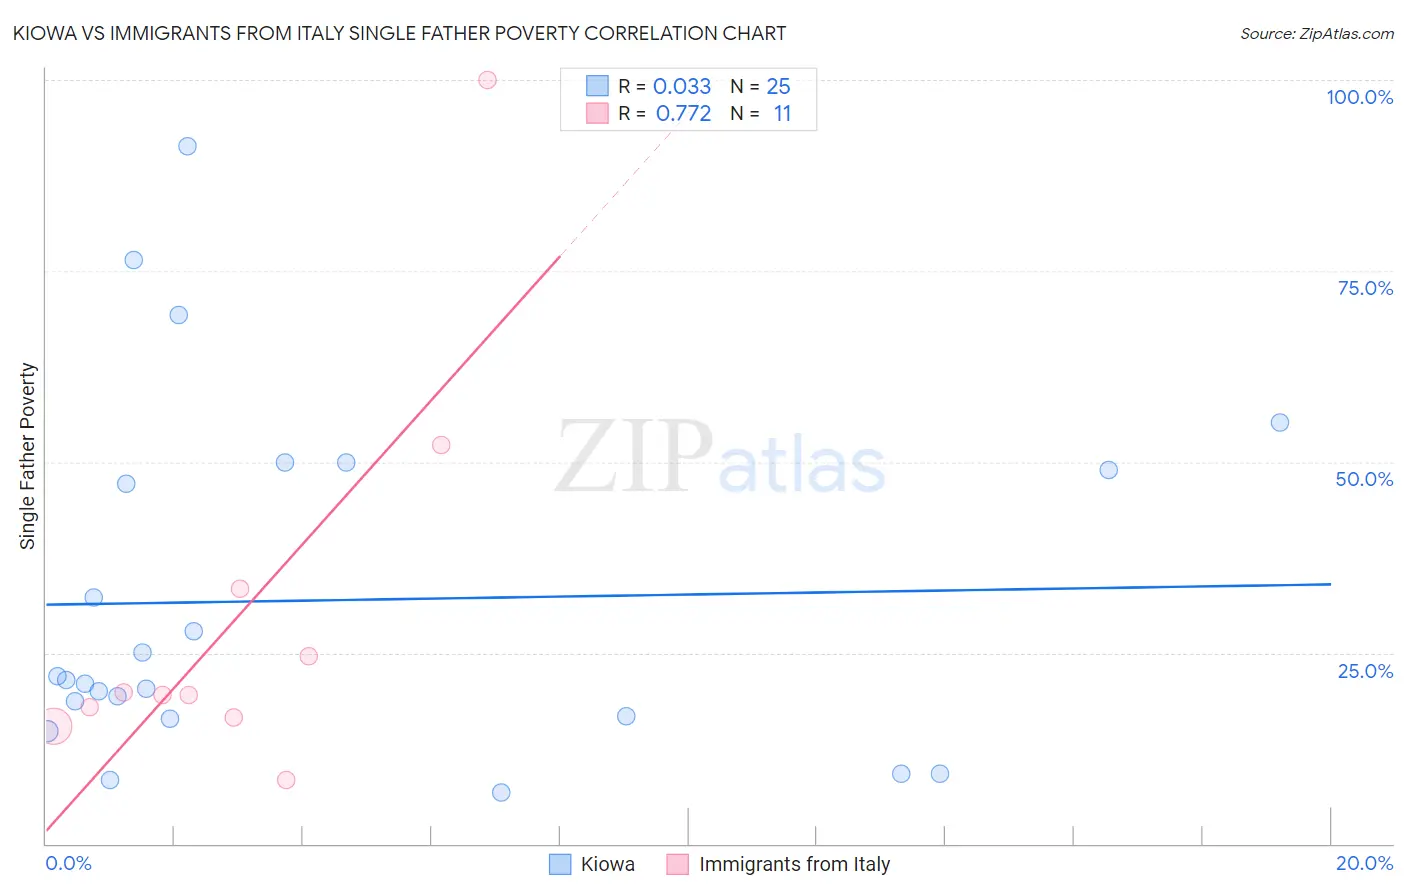
Kiowa vs Immigrants from Italy Single Father Poverty Correlation Chart
The statistical analysis conducted on geographies consisting of 53,338,998 people shows no correlation between the proportion of Kiowa and poverty level among single fathers in the United States with a correlation coefficient (R) of 0.033 and weighted average of 22.5%. Similarly, the statistical analysis conducted on geographies consisting of 255,121,399 people shows a strong positive correlation between the proportion of Immigrants from Italy and poverty level among single fathers in the United States with a correlation coefficient (R) of 0.772 and weighted average of 16.4%, a difference of 37.0%.
Single Father Poverty Correlation Summary
| Measurement | Kiowa | Immigrants from Italy |
| Minimum | 6.7% | 8.4% |
| Maximum | 91.3% | 100.0% |
| Range | 84.6% | 91.6% |
| Mean | 31.9% | 29.7% |
| Median | 21.5% | 19.5% |
| Interquartile 25% (IQ1) | 16.5% | 16.5% |
| Interquartile 75% (IQ3) | 49.5% | 33.3% |
| Interquartile Range (IQR) | 33.0% | 16.8% |
| Standard Deviation (Sample) | 22.9% | 26.0% |
| Standard Deviation (Population) | 22.5% | 24.8% |
Similar Demographics by Single Father Poverty
Demographics Similar to Kiowa by Single Father Poverty
In terms of single father poverty, the demographic groups most similar to Kiowa are Native/Alaskan (22.4%, a difference of 0.36%), Shoshone (22.9%, a difference of 2.0%), Tohono O'odham (22.0%, a difference of 2.1%), Cajun (23.1%, a difference of 2.7%), and Central American Indian (21.7%, a difference of 3.6%).
| Demographics | Rating | Rank | Single Father Poverty |
| Choctaw | 0.0 /100 | #327 | Tragic 20.7% |
| Pueblo | 0.0 /100 | #328 | Tragic 21.1% |
| Colville | 0.0 /100 | #329 | Tragic 21.4% |
| Paiute | 0.0 /100 | #330 | Tragic 21.6% |
| Central American Indians | 0.0 /100 | #331 | Tragic 21.7% |
| Tohono O'odham | 0.0 /100 | #332 | Tragic 22.0% |
| Natives/Alaskans | 0.0 /100 | #333 | Tragic 22.4% |
| Kiowa | 0.0 /100 | #334 | Tragic 22.5% |
| Shoshone | 0.0 /100 | #335 | Tragic 22.9% |
| Cajuns | 0.0 /100 | #336 | Tragic 23.1% |
| Sioux | 0.0 /100 | #337 | Tragic 23.9% |
| Arapaho | 0.0 /100 | #338 | Tragic 24.0% |
| Apache | 0.0 /100 | #339 | Tragic 24.2% |
| Houma | 0.0 /100 | #340 | Tragic 26.7% |
| Hopi | 0.0 /100 | #341 | Tragic 27.2% |
Demographics Similar to Immigrants from Italy by Single Father Poverty
In terms of single father poverty, the demographic groups most similar to Immigrants from Italy are Immigrants from Western Africa (16.4%, a difference of 0.010%), Aleut (16.4%, a difference of 0.020%), Cambodian (16.4%, a difference of 0.050%), Immigrants from Latin America (16.4%, a difference of 0.070%), and Panamanian (16.4%, a difference of 0.11%).
| Demographics | Rating | Rank | Single Father Poverty |
| Immigrants | Ecuador | 49.7 /100 | #175 | Average 16.3% |
| Vietnamese | 48.0 /100 | #176 | Average 16.3% |
| Immigrants | South Africa | 44.2 /100 | #177 | Average 16.3% |
| Immigrants | Cuba | 41.6 /100 | #178 | Average 16.4% |
| Serbians | 40.9 /100 | #179 | Average 16.4% |
| Immigrants | Latin America | 37.2 /100 | #180 | Fair 16.4% |
| Immigrants | Western Africa | 36.0 /100 | #181 | Fair 16.4% |
| Immigrants | Italy | 35.7 /100 | #182 | Fair 16.4% |
| Aleuts | 35.3 /100 | #183 | Fair 16.4% |
| Cambodians | 34.6 /100 | #184 | Fair 16.4% |
| Panamanians | 33.6 /100 | #185 | Fair 16.4% |
| Immigrants | Venezuela | 31.0 /100 | #186 | Fair 16.4% |
| Ukrainians | 30.4 /100 | #187 | Fair 16.4% |
| Russians | 30.1 /100 | #188 | Fair 16.4% |
| Latvians | 28.9 /100 | #189 | Fair 16.5% |