Marshallese vs Immigrants from Italy Median Male Earnings
COMPARE
Marshallese
Immigrants from Italy
Median Male Earnings
Median Male Earnings Comparison
Marshallese
Immigrants from Italy
$48,137
MEDIAN MALE EARNINGS
0.2/ 100
METRIC RATING
281st/ 347
METRIC RANK
$59,691
MEDIAN MALE EARNINGS
99.4/ 100
METRIC RATING
83rd/ 347
METRIC RANK
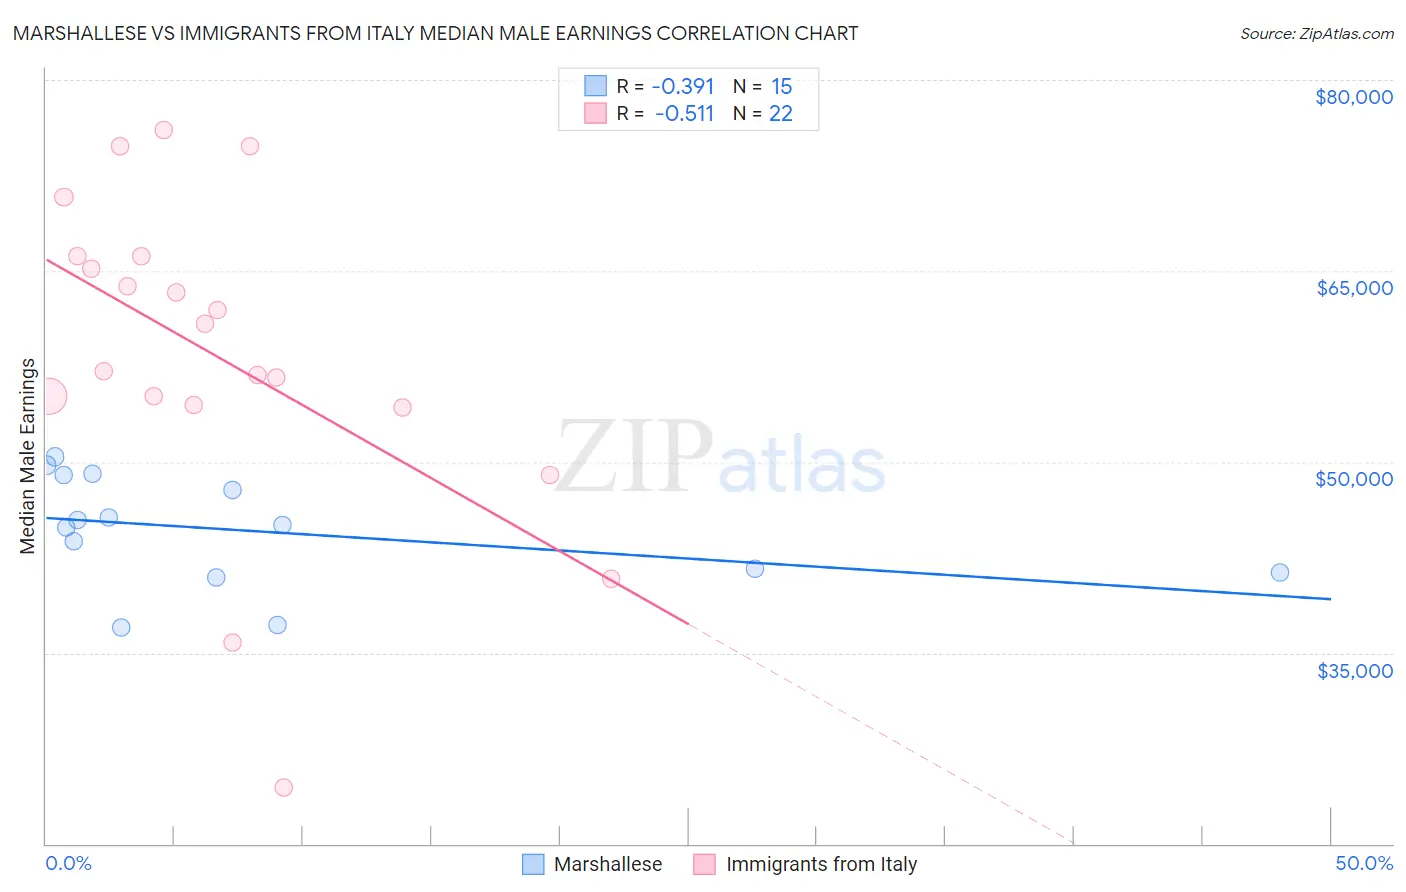
Marshallese vs Immigrants from Italy Median Male Earnings Correlation Chart
The statistical analysis conducted on geographies consisting of 14,760,790 people shows a mild negative correlation between the proportion of Marshallese and median male earnings in the United States with a correlation coefficient (R) of -0.391 and weighted average of $48,137. Similarly, the statistical analysis conducted on geographies consisting of 324,142,544 people shows a substantial negative correlation between the proportion of Immigrants from Italy and median male earnings in the United States with a correlation coefficient (R) of -0.511 and weighted average of $59,691, a difference of 24.0%.
Median Male Earnings Correlation Summary
| Measurement | Marshallese | Immigrants from Italy |
| Minimum | $37,012 | $24,375 |
| Maximum | $50,395 | $76,045 |
| Range | $13,383 | $51,670 |
| Mean | $44,583 | $58,332 |
| Median | $45,000 | $58,952 |
| Interquartile 25% (IQ1) | $41,333 | $54,435 |
| Interquartile 75% (IQ3) | $48,969 | $66,141 |
| Interquartile Range (IQR) | $7,636 | $11,706 |
| Standard Deviation (Sample) | $4,286 | $12,664 |
| Standard Deviation (Population) | $4,141 | $12,373 |
Similar Demographics by Median Male Earnings
Demographics Similar to Marshallese by Median Male Earnings
In terms of median male earnings, the demographic groups most similar to Marshallese are Central American ($48,093, a difference of 0.090%), Comanche ($48,202, a difference of 0.13%), Immigrants from Jamaica ($48,040, a difference of 0.20%), Hmong ($48,254, a difference of 0.24%), and African ($47,994, a difference of 0.30%).
| Demographics | Rating | Rank | Median Male Earnings |
| Colville | 0.3 /100 | #274 | Tragic $48,516 |
| Immigrants | Somalia | 0.3 /100 | #275 | Tragic $48,439 |
| Blackfeet | 0.3 /100 | #276 | Tragic $48,402 |
| Belizeans | 0.2 /100 | #277 | Tragic $48,358 |
| Immigrants | Liberia | 0.2 /100 | #278 | Tragic $48,317 |
| Hmong | 0.2 /100 | #279 | Tragic $48,254 |
| Comanche | 0.2 /100 | #280 | Tragic $48,202 |
| Marshallese | 0.2 /100 | #281 | Tragic $48,137 |
| Central Americans | 0.2 /100 | #282 | Tragic $48,093 |
| Immigrants | Jamaica | 0.2 /100 | #283 | Tragic $48,040 |
| Africans | 0.2 /100 | #284 | Tragic $47,994 |
| Paiute | 0.2 /100 | #285 | Tragic $47,991 |
| Mexican American Indians | 0.2 /100 | #286 | Tragic $47,990 |
| Immigrants | El Salvador | 0.2 /100 | #287 | Tragic $47,973 |
| Shoshone | 0.2 /100 | #288 | Tragic $47,930 |
Demographics Similar to Immigrants from Italy by Median Male Earnings
In terms of median male earnings, the demographic groups most similar to Immigrants from Italy are Croatian ($59,715, a difference of 0.040%), Ukrainian ($59,728, a difference of 0.060%), Immigrants from Hungary ($59,806, a difference of 0.19%), Immigrants from Ukraine ($59,820, a difference of 0.22%), and Afghan ($59,554, a difference of 0.23%).
| Demographics | Rating | Rank | Median Male Earnings |
| Romanians | 99.6 /100 | #76 | Exceptional $60,063 |
| Paraguayans | 99.5 /100 | #77 | Exceptional $59,975 |
| Immigrants | Egypt | 99.5 /100 | #78 | Exceptional $59,925 |
| Immigrants | Ukraine | 99.5 /100 | #79 | Exceptional $59,820 |
| Immigrants | Hungary | 99.5 /100 | #80 | Exceptional $59,806 |
| Ukrainians | 99.4 /100 | #81 | Exceptional $59,728 |
| Croatians | 99.4 /100 | #82 | Exceptional $59,715 |
| Immigrants | Italy | 99.4 /100 | #83 | Exceptional $59,691 |
| Afghans | 99.3 /100 | #84 | Exceptional $59,554 |
| Italians | 99.3 /100 | #85 | Exceptional $59,551 |
| Immigrants | England | 99.3 /100 | #86 | Exceptional $59,527 |
| Macedonians | 99.3 /100 | #87 | Exceptional $59,522 |
| Immigrants | Argentina | 99.3 /100 | #88 | Exceptional $59,491 |
| Immigrants | Moldova | 99.2 /100 | #89 | Exceptional $59,417 |
| Austrians | 99.2 /100 | #90 | Exceptional $59,359 |