Maltese vs Portuguese Family Poverty
COMPARE
Maltese
Portuguese
Family Poverty
Family Poverty Comparison
Maltese
Portuguese
7.1%
FAMILY POVERTY
99.8/ 100
METRIC RATING
12th/ 347
METRIC RANK
8.4%
FAMILY POVERTY
89.2/ 100
METRIC RATING
129th/ 347
METRIC RANK
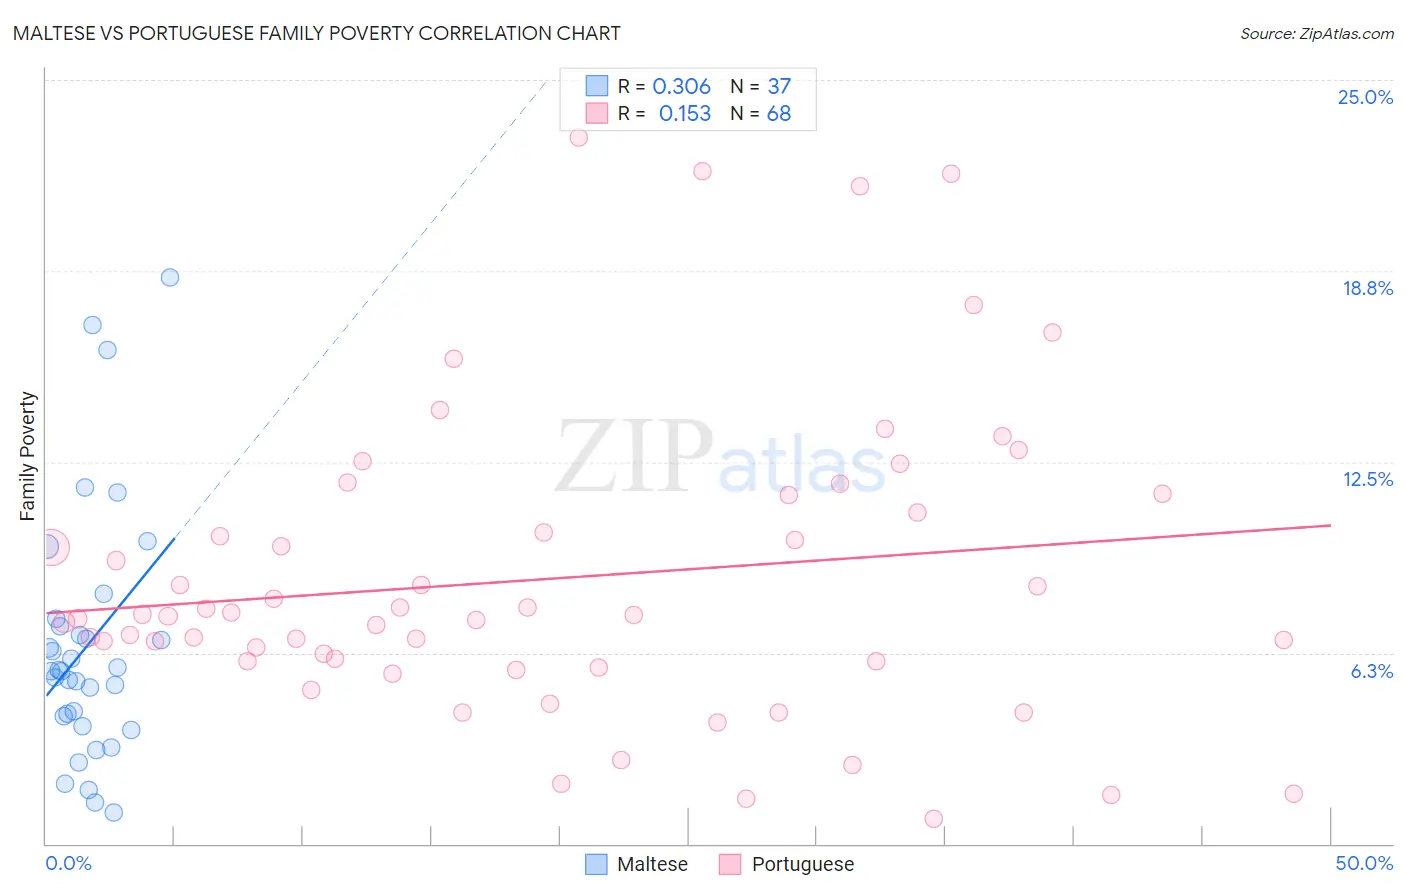
Maltese vs Portuguese Family Poverty Correlation Chart
The statistical analysis conducted on geographies consisting of 126,303,911 people shows a mild positive correlation between the proportion of Maltese and poverty level among families in the United States with a correlation coefficient (R) of 0.306 and weighted average of 7.1%. Similarly, the statistical analysis conducted on geographies consisting of 448,364,700 people shows a poor positive correlation between the proportion of Portuguese and poverty level among families in the United States with a correlation coefficient (R) of 0.153 and weighted average of 8.4%, a difference of 17.8%.
Family Poverty Correlation Summary
| Measurement | Maltese | Portuguese |
| Minimum | 1.0% | 0.81% |
| Maximum | 18.6% | 23.1% |
| Range | 17.5% | 22.3% |
| Mean | 6.5% | 8.7% |
| Median | 5.7% | 7.5% |
| Interquartile 25% (IQ1) | 4.0% | 6.0% |
| Interquartile 75% (IQ3) | 7.2% | 11.1% |
| Interquartile Range (IQR) | 3.2% | 5.1% |
| Standard Deviation (Sample) | 4.1% | 5.0% |
| Standard Deviation (Population) | 4.0% | 4.9% |
Similar Demographics by Family Poverty
Demographics Similar to Maltese by Family Poverty
In terms of family poverty, the demographic groups most similar to Maltese are Swedish (7.1%, a difference of 0.050%), Iranian (7.1%, a difference of 0.060%), Immigrants from Singapore (7.1%, a difference of 0.29%), Bulgarian (7.1%, a difference of 0.30%), and Latvian (7.1%, a difference of 0.55%).
| Demographics | Rating | Rank | Family Poverty |
| Thais | 100.0 /100 | #5 | Exceptional 6.7% |
| Norwegians | 99.9 /100 | #6 | Exceptional 6.9% |
| Immigrants | Ireland | 99.9 /100 | #7 | Exceptional 7.0% |
| Bhutanese | 99.9 /100 | #8 | Exceptional 7.0% |
| Latvians | 99.9 /100 | #9 | Exceptional 7.1% |
| Bulgarians | 99.8 /100 | #10 | Exceptional 7.1% |
| Immigrants | Singapore | 99.8 /100 | #11 | Exceptional 7.1% |
| Maltese | 99.8 /100 | #12 | Exceptional 7.1% |
| Swedes | 99.8 /100 | #13 | Exceptional 7.1% |
| Iranians | 99.8 /100 | #14 | Exceptional 7.1% |
| Lithuanians | 99.8 /100 | #15 | Exceptional 7.2% |
| Immigrants | South Central Asia | 99.8 /100 | #16 | Exceptional 7.2% |
| Luxembourgers | 99.8 /100 | #17 | Exceptional 7.2% |
| Immigrants | Lithuania | 99.8 /100 | #18 | Exceptional 7.2% |
| Eastern Europeans | 99.7 /100 | #19 | Exceptional 7.2% |
Demographics Similar to Portuguese by Family Poverty
In terms of family poverty, the demographic groups most similar to Portuguese are Argentinean (8.4%, a difference of 0.15%), Immigrants from Bosnia and Herzegovina (8.4%, a difference of 0.18%), Puget Sound Salish (8.4%, a difference of 0.19%), Immigrants from Hungary (8.4%, a difference of 0.30%), and Immigrants from Argentina (8.4%, a difference of 0.34%).
| Demographics | Rating | Rank | Family Poverty |
| Paraguayans | 91.2 /100 | #122 | Exceptional 8.3% |
| Palestinians | 91.1 /100 | #123 | Exceptional 8.3% |
| Soviet Union | 90.8 /100 | #124 | Exceptional 8.3% |
| Pakistanis | 90.8 /100 | #125 | Exceptional 8.3% |
| Icelanders | 90.3 /100 | #126 | Exceptional 8.3% |
| Immigrants | Hungary | 89.9 /100 | #127 | Excellent 8.4% |
| Argentineans | 89.6 /100 | #128 | Excellent 8.4% |
| Portuguese | 89.2 /100 | #129 | Excellent 8.4% |
| Immigrants | Bosnia and Herzegovina | 88.6 /100 | #130 | Excellent 8.4% |
| Puget Sound Salish | 88.6 /100 | #131 | Excellent 8.4% |
| Immigrants | Argentina | 88.2 /100 | #132 | Excellent 8.4% |
| Sri Lankans | 86.6 /100 | #133 | Excellent 8.5% |
| Chileans | 86.6 /100 | #134 | Excellent 8.5% |
| Immigrants | Malaysia | 86.5 /100 | #135 | Excellent 8.5% |
| Immigrants | Brazil | 86.3 /100 | #136 | Excellent 8.5% |