Maltese vs Immigrants from North Macedonia Family Poverty
COMPARE
Maltese
Immigrants from North Macedonia
Family Poverty
Family Poverty Comparison
Maltese
Immigrants from North Macedonia
7.1%
FAMILY POVERTY
99.8/ 100
METRIC RATING
12th/ 347
METRIC RANK
7.7%
FAMILY POVERTY
98.9/ 100
METRIC RATING
50th/ 347
METRIC RANK
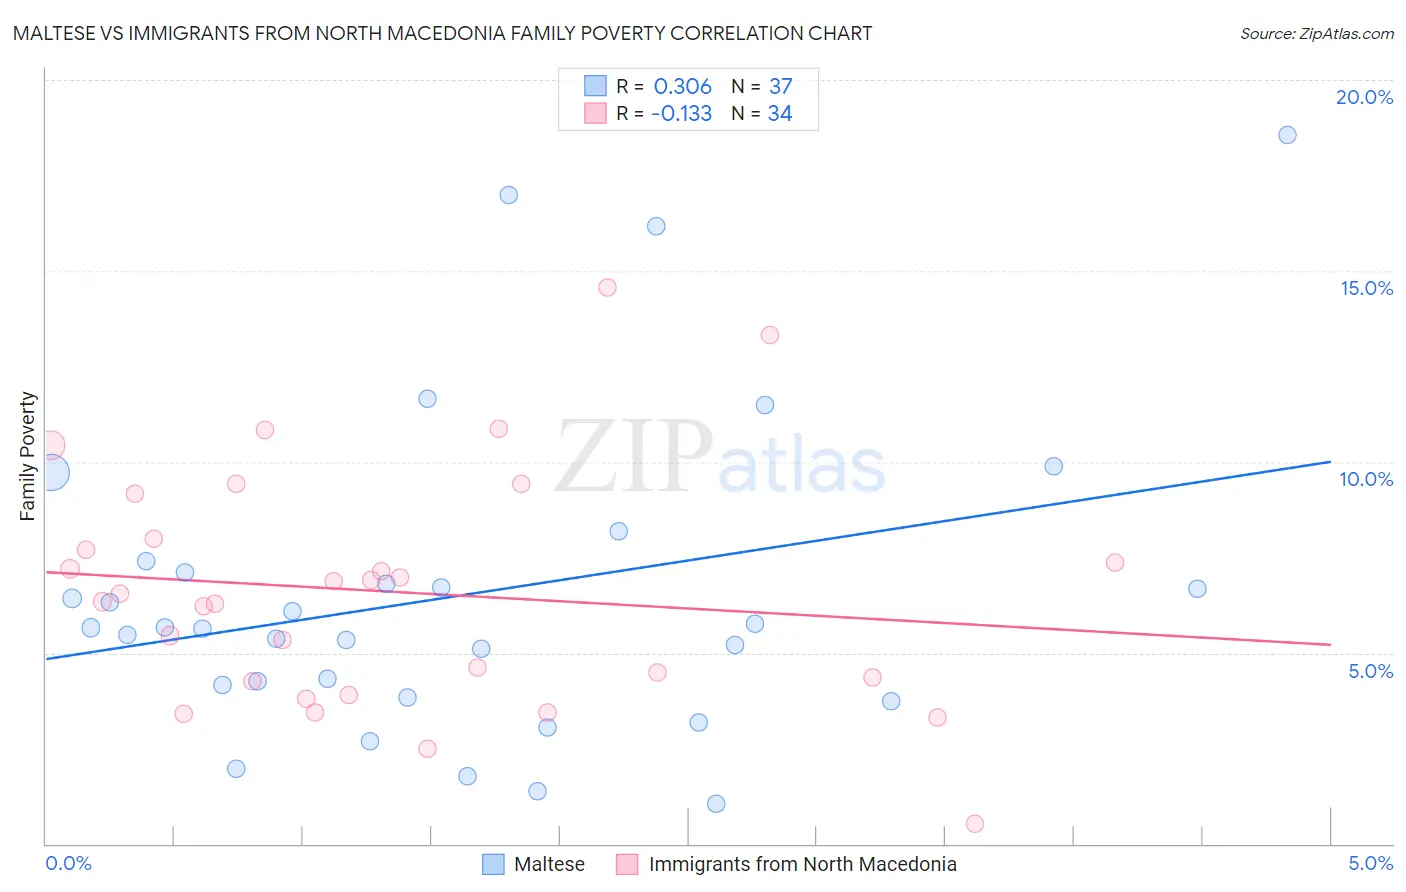
Maltese vs Immigrants from North Macedonia Family Poverty Correlation Chart
The statistical analysis conducted on geographies consisting of 126,303,911 people shows a mild positive correlation between the proportion of Maltese and poverty level among families in the United States with a correlation coefficient (R) of 0.306 and weighted average of 7.1%. Similarly, the statistical analysis conducted on geographies consisting of 74,220,481 people shows a poor negative correlation between the proportion of Immigrants from North Macedonia and poverty level among families in the United States with a correlation coefficient (R) of -0.133 and weighted average of 7.7%, a difference of 8.0%.
Family Poverty Correlation Summary
| Measurement | Maltese | Immigrants from North Macedonia |
| Minimum | 1.0% | 0.51% |
| Maximum | 18.6% | 14.6% |
| Range | 17.5% | 14.0% |
| Mean | 6.5% | 6.6% |
| Median | 5.7% | 6.4% |
| Interquartile 25% (IQ1) | 4.0% | 4.3% |
| Interquartile 75% (IQ3) | 7.2% | 8.0% |
| Interquartile Range (IQR) | 3.2% | 3.7% |
| Standard Deviation (Sample) | 4.1% | 3.1% |
| Standard Deviation (Population) | 4.0% | 3.1% |
Similar Demographics by Family Poverty
Demographics Similar to Maltese by Family Poverty
In terms of family poverty, the demographic groups most similar to Maltese are Swedish (7.1%, a difference of 0.050%), Iranian (7.1%, a difference of 0.060%), Immigrants from Singapore (7.1%, a difference of 0.29%), Bulgarian (7.1%, a difference of 0.30%), and Latvian (7.1%, a difference of 0.55%).
| Demographics | Rating | Rank | Family Poverty |
| Thais | 100.0 /100 | #5 | Exceptional 6.7% |
| Norwegians | 99.9 /100 | #6 | Exceptional 6.9% |
| Immigrants | Ireland | 99.9 /100 | #7 | Exceptional 7.0% |
| Bhutanese | 99.9 /100 | #8 | Exceptional 7.0% |
| Latvians | 99.9 /100 | #9 | Exceptional 7.1% |
| Bulgarians | 99.8 /100 | #10 | Exceptional 7.1% |
| Immigrants | Singapore | 99.8 /100 | #11 | Exceptional 7.1% |
| Maltese | 99.8 /100 | #12 | Exceptional 7.1% |
| Swedes | 99.8 /100 | #13 | Exceptional 7.1% |
| Iranians | 99.8 /100 | #14 | Exceptional 7.1% |
| Lithuanians | 99.8 /100 | #15 | Exceptional 7.2% |
| Immigrants | South Central Asia | 99.8 /100 | #16 | Exceptional 7.2% |
| Luxembourgers | 99.8 /100 | #17 | Exceptional 7.2% |
| Immigrants | Lithuania | 99.8 /100 | #18 | Exceptional 7.2% |
| Eastern Europeans | 99.7 /100 | #19 | Exceptional 7.2% |
Demographics Similar to Immigrants from North Macedonia by Family Poverty
In terms of family poverty, the demographic groups most similar to Immigrants from North Macedonia are Immigrants from Bolivia (7.7%, a difference of 0.030%), Immigrants from Moldova (7.7%, a difference of 0.15%), Immigrants from Sri Lanka (7.7%, a difference of 0.22%), Immigrants from Czechoslovakia (7.7%, a difference of 0.23%), and Tongan (7.7%, a difference of 0.25%).
| Demographics | Rating | Rank | Family Poverty |
| Immigrants | Austria | 99.1 /100 | #43 | Exceptional 7.6% |
| Germans | 99.0 /100 | #44 | Exceptional 7.7% |
| Okinawans | 98.9 /100 | #45 | Exceptional 7.7% |
| Tongans | 98.9 /100 | #46 | Exceptional 7.7% |
| Immigrants | Czechoslovakia | 98.9 /100 | #47 | Exceptional 7.7% |
| Immigrants | Sri Lanka | 98.9 /100 | #48 | Exceptional 7.7% |
| Immigrants | Bolivia | 98.9 /100 | #49 | Exceptional 7.7% |
| Immigrants | North Macedonia | 98.9 /100 | #50 | Exceptional 7.7% |
| Immigrants | Moldova | 98.8 /100 | #51 | Exceptional 7.7% |
| Indians (Asian) | 98.8 /100 | #52 | Exceptional 7.7% |
| Swiss | 98.8 /100 | #53 | Exceptional 7.7% |
| Immigrants | Sweden | 98.8 /100 | #54 | Exceptional 7.7% |
| Immigrants | Eastern Asia | 98.7 /100 | #55 | Exceptional 7.7% |
| Immigrants | Serbia | 98.7 /100 | #56 | Exceptional 7.7% |
| Asians | 98.7 /100 | #57 | Exceptional 7.7% |