Maltese vs Immigrants from Asia Single Female Poverty
COMPARE
Maltese
Immigrants from Asia
Single Female Poverty
Single Female Poverty Comparison
Maltese
Immigrants from Asia
18.3%
SINGLE FEMALE POVERTY
100.0/ 100
METRIC RATING
21st/ 347
METRIC RANK
18.6%
SINGLE FEMALE POVERTY
99.9/ 100
METRIC RATING
31st/ 347
METRIC RANK
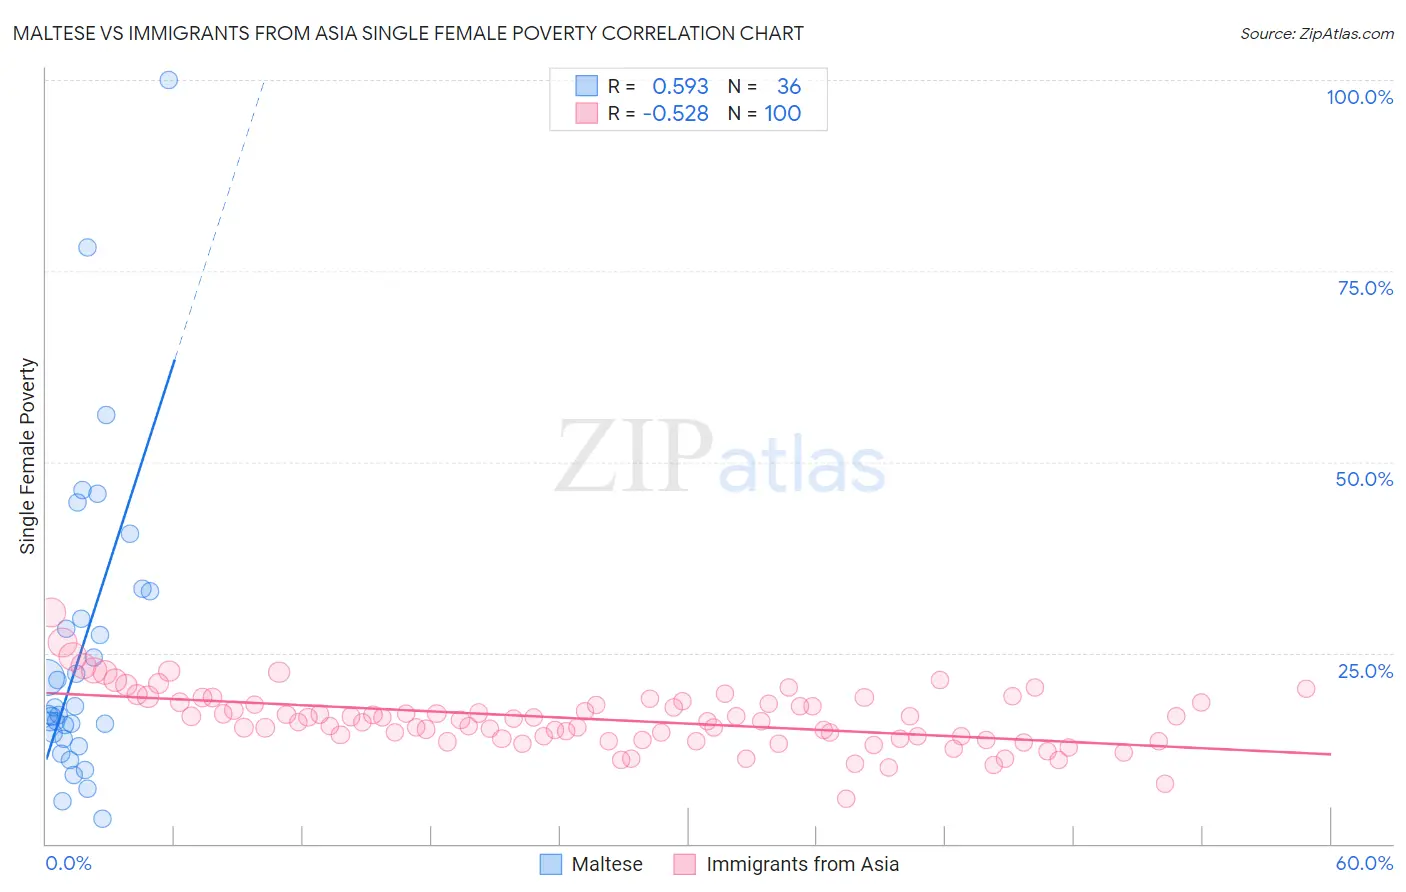
Maltese vs Immigrants from Asia Single Female Poverty Correlation Chart
The statistical analysis conducted on geographies consisting of 125,419,200 people shows a substantial positive correlation between the proportion of Maltese and poverty level among single females in the United States with a correlation coefficient (R) of 0.593 and weighted average of 18.3%. Similarly, the statistical analysis conducted on geographies consisting of 532,712,278 people shows a substantial negative correlation between the proportion of Immigrants from Asia and poverty level among single females in the United States with a correlation coefficient (R) of -0.528 and weighted average of 18.6%, a difference of 1.5%.
Single Female Poverty Correlation Summary
| Measurement | Maltese | Immigrants from Asia |
| Minimum | 3.3% | 5.9% |
| Maximum | 100.0% | 30.3% |
| Range | 96.7% | 24.4% |
| Mean | 25.4% | 16.3% |
| Median | 17.4% | 16.3% |
| Interquartile 25% (IQ1) | 14.1% | 13.8% |
| Interquartile 75% (IQ3) | 31.2% | 18.6% |
| Interquartile Range (IQR) | 17.1% | 4.8% |
| Standard Deviation (Sample) | 20.2% | 3.9% |
| Standard Deviation (Population) | 19.9% | 3.8% |
Demographics Similar to Maltese and Immigrants from Asia by Single Female Poverty
In terms of single female poverty, the demographic groups most similar to Maltese are Burmese (18.3%, a difference of 0.010%), Asian (18.3%, a difference of 0.020%), Immigrants from Greece (18.3%, a difference of 0.060%), Armenian (18.3%, a difference of 0.24%), and Immigrants from Singapore (18.3%, a difference of 0.34%). Similarly, the demographic groups most similar to Immigrants from Asia are Immigrants from North Macedonia (18.5%, a difference of 0.050%), Immigrants from Sri Lanka (18.6%, a difference of 0.090%), Immigrants from Philippines (18.6%, a difference of 0.15%), Immigrants from Poland (18.5%, a difference of 0.21%), and Immigrants from Moldova (18.5%, a difference of 0.31%).
| Demographics | Rating | Rank | Single Female Poverty |
| Iranians | 100.0 /100 | #16 | Exceptional 18.0% |
| Immigrants | Korea | 100.0 /100 | #17 | Exceptional 18.1% |
| Immigrants | Eastern Asia | 100.0 /100 | #18 | Exceptional 18.1% |
| Immigrants | China | 100.0 /100 | #19 | Exceptional 18.1% |
| Immigrants | Greece | 100.0 /100 | #20 | Exceptional 18.3% |
| Maltese | 100.0 /100 | #21 | Exceptional 18.3% |
| Burmese | 100.0 /100 | #22 | Exceptional 18.3% |
| Asians | 100.0 /100 | #23 | Exceptional 18.3% |
| Armenians | 100.0 /100 | #24 | Exceptional 18.3% |
| Immigrants | Singapore | 100.0 /100 | #25 | Exceptional 18.3% |
| Immigrants | Israel | 100.0 /100 | #26 | Exceptional 18.3% |
| Immigrants | Pakistan | 100.0 /100 | #27 | Exceptional 18.4% |
| Immigrants | Moldova | 100.0 /100 | #28 | Exceptional 18.5% |
| Immigrants | Poland | 100.0 /100 | #29 | Exceptional 18.5% |
| Immigrants | North Macedonia | 99.9 /100 | #30 | Exceptional 18.5% |
| Immigrants | Asia | 99.9 /100 | #31 | Exceptional 18.6% |
| Immigrants | Sri Lanka | 99.9 /100 | #32 | Exceptional 18.6% |
| Immigrants | Philippines | 99.9 /100 | #33 | Exceptional 18.6% |
| Koreans | 99.9 /100 | #34 | Exceptional 18.6% |
| Immigrants | Japan | 99.9 /100 | #35 | Exceptional 18.6% |
| Turks | 99.9 /100 | #36 | Exceptional 18.7% |