Maltese vs Immigrants from Germany Single Mother Poverty
COMPARE
Maltese
Immigrants from Germany
Single Mother Poverty
Single Mother Poverty Comparison
Maltese
Immigrants from Germany
26.6%
SINGLE MOTHER POVERTY
99.9/ 100
METRIC RATING
35th/ 347
METRIC RANK
29.5%
SINGLE MOTHER POVERTY
30.4/ 100
METRIC RATING
190th/ 347
METRIC RANK
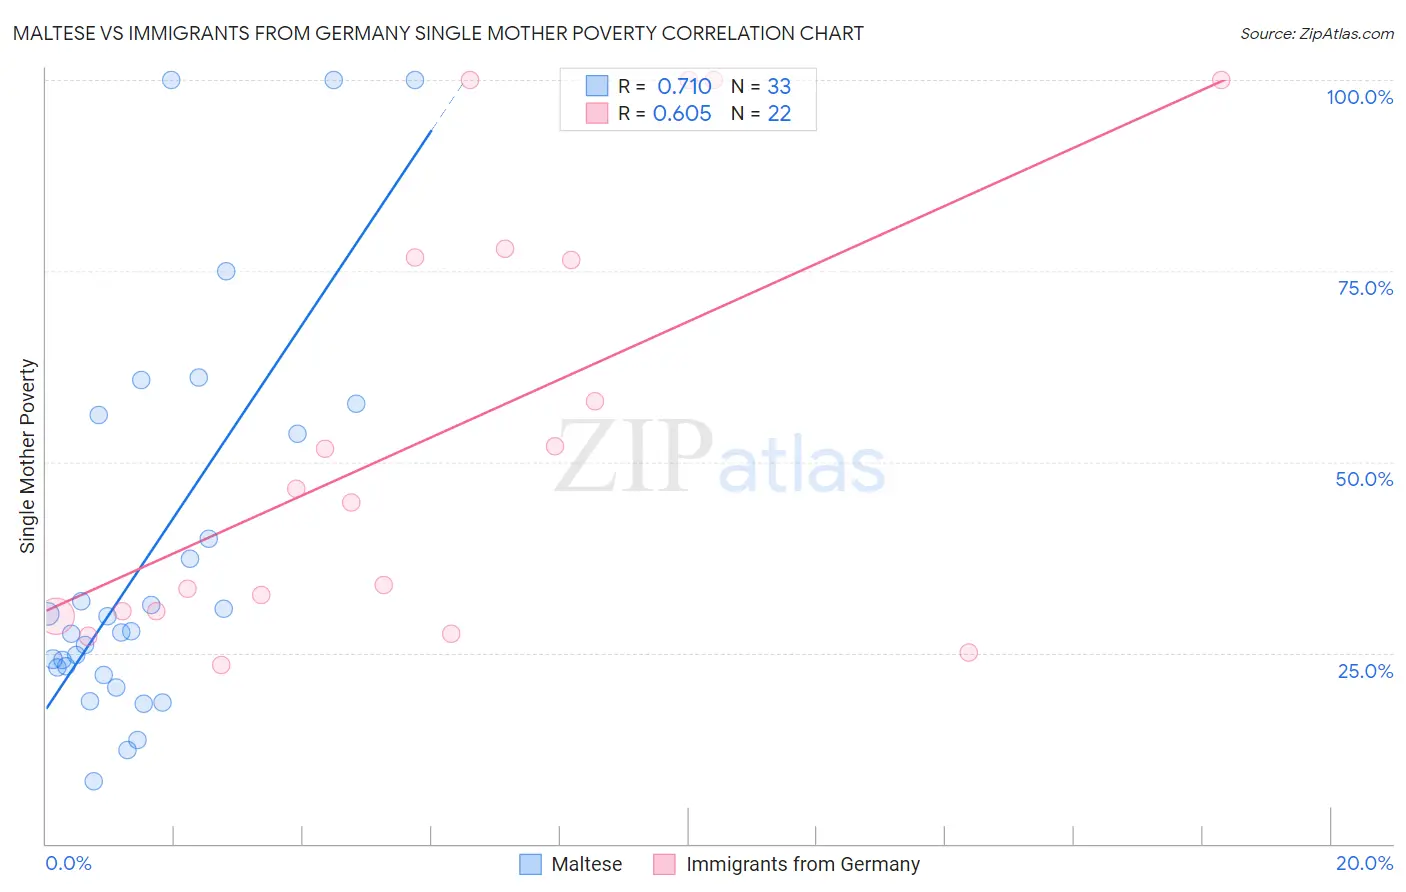
Maltese vs Immigrants from Germany Single Mother Poverty Correlation Chart
The statistical analysis conducted on geographies consisting of 124,400,291 people shows a strong positive correlation between the proportion of Maltese and poverty level among single mothers in the United States with a correlation coefficient (R) of 0.710 and weighted average of 26.6%. Similarly, the statistical analysis conducted on geographies consisting of 449,496,540 people shows a significant positive correlation between the proportion of Immigrants from Germany and poverty level among single mothers in the United States with a correlation coefficient (R) of 0.605 and weighted average of 29.5%, a difference of 10.8%.
Single Mother Poverty Correlation Summary
| Measurement | Maltese | Immigrants from Germany |
| Minimum | 8.2% | 23.4% |
| Maximum | 100.0% | 100.0% |
| Range | 91.8% | 76.6% |
| Mean | 38.1% | 53.5% |
| Median | 27.8% | 45.6% |
| Interquartile 25% (IQ1) | 22.6% | 30.4% |
| Interquartile 75% (IQ3) | 54.9% | 76.8% |
| Interquartile Range (IQR) | 32.3% | 46.4% |
| Standard Deviation (Sample) | 25.3% | 28.0% |
| Standard Deviation (Population) | 24.9% | 27.3% |
Similar Demographics by Single Mother Poverty
Demographics Similar to Maltese by Single Mother Poverty
In terms of single mother poverty, the demographic groups most similar to Maltese are Okinawan (26.6%, a difference of 0.050%), Immigrants from Israel (26.6%, a difference of 0.050%), Immigrants from Fiji (26.6%, a difference of 0.090%), Immigrants from Indonesia (26.6%, a difference of 0.12%), and Bulgarian (26.5%, a difference of 0.13%).
| Demographics | Rating | Rank | Single Mother Poverty |
| Koreans | 100.0 /100 | #28 | Exceptional 26.4% |
| Jordanians | 100.0 /100 | #29 | Exceptional 26.4% |
| Turks | 100.0 /100 | #30 | Exceptional 26.4% |
| Immigrants | Philippines | 100.0 /100 | #31 | Exceptional 26.5% |
| Tongans | 99.9 /100 | #32 | Exceptional 26.5% |
| Bulgarians | 99.9 /100 | #33 | Exceptional 26.5% |
| Immigrants | Indonesia | 99.9 /100 | #34 | Exceptional 26.6% |
| Maltese | 99.9 /100 | #35 | Exceptional 26.6% |
| Okinawans | 99.9 /100 | #36 | Exceptional 26.6% |
| Immigrants | Israel | 99.9 /100 | #37 | Exceptional 26.6% |
| Immigrants | Fiji | 99.9 /100 | #38 | Exceptional 26.6% |
| Sri Lankans | 99.9 /100 | #39 | Exceptional 26.7% |
| Immigrants | Vietnam | 99.9 /100 | #40 | Exceptional 26.7% |
| Immigrants | Greece | 99.9 /100 | #41 | Exceptional 26.7% |
| Armenians | 99.9 /100 | #42 | Exceptional 26.8% |
Demographics Similar to Immigrants from Germany by Single Mother Poverty
In terms of single mother poverty, the demographic groups most similar to Immigrants from Germany are Guamanian/Chamorro (29.4%, a difference of 0.070%), Immigrants from Africa (29.4%, a difference of 0.070%), Immigrants from Trinidad and Tobago (29.5%, a difference of 0.070%), Moroccan (29.5%, a difference of 0.10%), and Lebanese (29.4%, a difference of 0.11%).
| Demographics | Rating | Rank | Single Mother Poverty |
| Nepalese | 38.3 /100 | #183 | Fair 29.3% |
| Nigerians | 38.0 /100 | #184 | Fair 29.3% |
| Ghanaians | 36.8 /100 | #185 | Fair 29.4% |
| Yugoslavians | 36.0 /100 | #186 | Fair 29.4% |
| Lebanese | 32.5 /100 | #187 | Fair 29.4% |
| Guamanians/Chamorros | 31.8 /100 | #188 | Fair 29.4% |
| Immigrants | Africa | 31.6 /100 | #189 | Fair 29.4% |
| Immigrants | Germany | 30.4 /100 | #190 | Fair 29.5% |
| Immigrants | Trinidad and Tobago | 29.2 /100 | #191 | Fair 29.5% |
| Moroccans | 28.6 /100 | #192 | Fair 29.5% |
| Basques | 28.3 /100 | #193 | Fair 29.5% |
| Icelanders | 26.1 /100 | #194 | Fair 29.5% |
| Slavs | 24.5 /100 | #195 | Fair 29.6% |
| Spanish American Indians | 23.4 /100 | #196 | Fair 29.6% |
| Immigrants | Jamaica | 22.0 /100 | #197 | Fair 29.6% |