Maltese vs British West Indian Single Mother Poverty
COMPARE
Maltese
British West Indian
Single Mother Poverty
Single Mother Poverty Comparison
Maltese
British West Indians
26.6%
SINGLE MOTHER POVERTY
99.9/ 100
METRIC RATING
35th/ 347
METRIC RANK
31.5%
SINGLE MOTHER POVERTY
0.1/ 100
METRIC RATING
270th/ 347
METRIC RANK
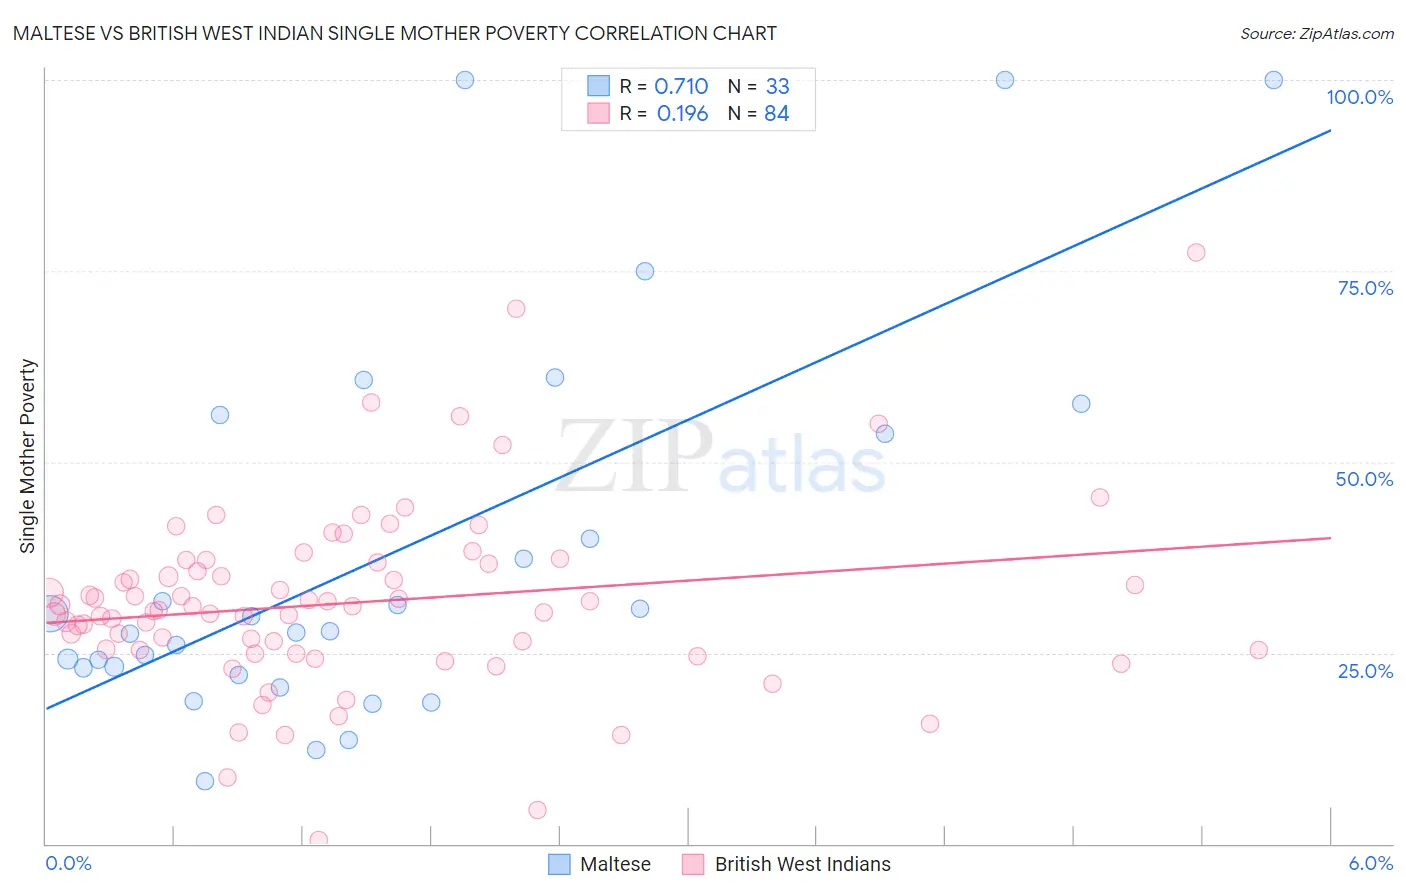
Maltese vs British West Indian Single Mother Poverty Correlation Chart
The statistical analysis conducted on geographies consisting of 124,400,291 people shows a strong positive correlation between the proportion of Maltese and poverty level among single mothers in the United States with a correlation coefficient (R) of 0.710 and weighted average of 26.6%. Similarly, the statistical analysis conducted on geographies consisting of 151,437,686 people shows a poor positive correlation between the proportion of British West Indians and poverty level among single mothers in the United States with a correlation coefficient (R) of 0.196 and weighted average of 31.5%, a difference of 18.5%.
Single Mother Poverty Correlation Summary
| Measurement | Maltese | British West Indian |
| Minimum | 8.2% | 0.48% |
| Maximum | 100.0% | 77.3% |
| Range | 91.8% | 76.9% |
| Mean | 38.1% | 31.6% |
| Median | 27.8% | 30.9% |
| Interquartile 25% (IQ1) | 22.6% | 25.4% |
| Interquartile 75% (IQ3) | 54.9% | 36.7% |
| Interquartile Range (IQR) | 32.3% | 11.3% |
| Standard Deviation (Sample) | 25.3% | 12.1% |
| Standard Deviation (Population) | 24.9% | 12.0% |
Similar Demographics by Single Mother Poverty
Demographics Similar to Maltese by Single Mother Poverty
In terms of single mother poverty, the demographic groups most similar to Maltese are Okinawan (26.6%, a difference of 0.050%), Immigrants from Israel (26.6%, a difference of 0.050%), Immigrants from Fiji (26.6%, a difference of 0.090%), Immigrants from Indonesia (26.6%, a difference of 0.12%), and Bulgarian (26.5%, a difference of 0.13%).
| Demographics | Rating | Rank | Single Mother Poverty |
| Koreans | 100.0 /100 | #28 | Exceptional 26.4% |
| Jordanians | 100.0 /100 | #29 | Exceptional 26.4% |
| Turks | 100.0 /100 | #30 | Exceptional 26.4% |
| Immigrants | Philippines | 100.0 /100 | #31 | Exceptional 26.5% |
| Tongans | 99.9 /100 | #32 | Exceptional 26.5% |
| Bulgarians | 99.9 /100 | #33 | Exceptional 26.5% |
| Immigrants | Indonesia | 99.9 /100 | #34 | Exceptional 26.6% |
| Maltese | 99.9 /100 | #35 | Exceptional 26.6% |
| Okinawans | 99.9 /100 | #36 | Exceptional 26.6% |
| Immigrants | Israel | 99.9 /100 | #37 | Exceptional 26.6% |
| Immigrants | Fiji | 99.9 /100 | #38 | Exceptional 26.6% |
| Sri Lankans | 99.9 /100 | #39 | Exceptional 26.7% |
| Immigrants | Vietnam | 99.9 /100 | #40 | Exceptional 26.7% |
| Immigrants | Greece | 99.9 /100 | #41 | Exceptional 26.7% |
| Armenians | 99.9 /100 | #42 | Exceptional 26.8% |
Demographics Similar to British West Indians by Single Mother Poverty
In terms of single mother poverty, the demographic groups most similar to British West Indians are Scotch-Irish (31.5%, a difference of 0.050%), Immigrants from Senegal (31.5%, a difference of 0.090%), Immigrants from Cabo Verde (31.6%, a difference of 0.24%), Immigrants from Micronesia (31.6%, a difference of 0.26%), and Immigrants from Belize (31.4%, a difference of 0.27%).
| Demographics | Rating | Rank | Single Mother Poverty |
| Bahamians | 0.2 /100 | #263 | Tragic 31.3% |
| Immigrants | Ecuador | 0.2 /100 | #264 | Tragic 31.3% |
| German Russians | 0.2 /100 | #265 | Tragic 31.3% |
| Sub-Saharan Africans | 0.2 /100 | #266 | Tragic 31.4% |
| Immigrants | Belize | 0.2 /100 | #267 | Tragic 31.4% |
| Immigrants | Senegal | 0.1 /100 | #268 | Tragic 31.5% |
| Scotch-Irish | 0.1 /100 | #269 | Tragic 31.5% |
| British West Indians | 0.1 /100 | #270 | Tragic 31.5% |
| Immigrants | Cabo Verde | 0.1 /100 | #271 | Tragic 31.6% |
| Immigrants | Micronesia | 0.1 /100 | #272 | Tragic 31.6% |
| Fijians | 0.1 /100 | #273 | Tragic 31.6% |
| Bangladeshis | 0.1 /100 | #274 | Tragic 31.7% |
| Central Americans | 0.1 /100 | #275 | Tragic 31.8% |
| Delaware | 0.0 /100 | #276 | Tragic 31.8% |
| Mexican American Indians | 0.0 /100 | #277 | Tragic 31.9% |