Macedonian vs Native/Alaskan Child Poverty Under the Age of 5
COMPARE
Macedonian
Native/Alaskan
Child Poverty Under the Age of 5
Child Poverty Under the Age of 5 Comparison
Macedonians
Natives/Alaskans
15.8%
CHILD POVERTY UNDER THE AGE OF 5
96.2/ 100
METRIC RATING
97th/ 347
METRIC RANK
25.6%
CHILD POVERTY UNDER THE AGE OF 5
0.0/ 100
METRIC RATING
333rd/ 347
METRIC RANK
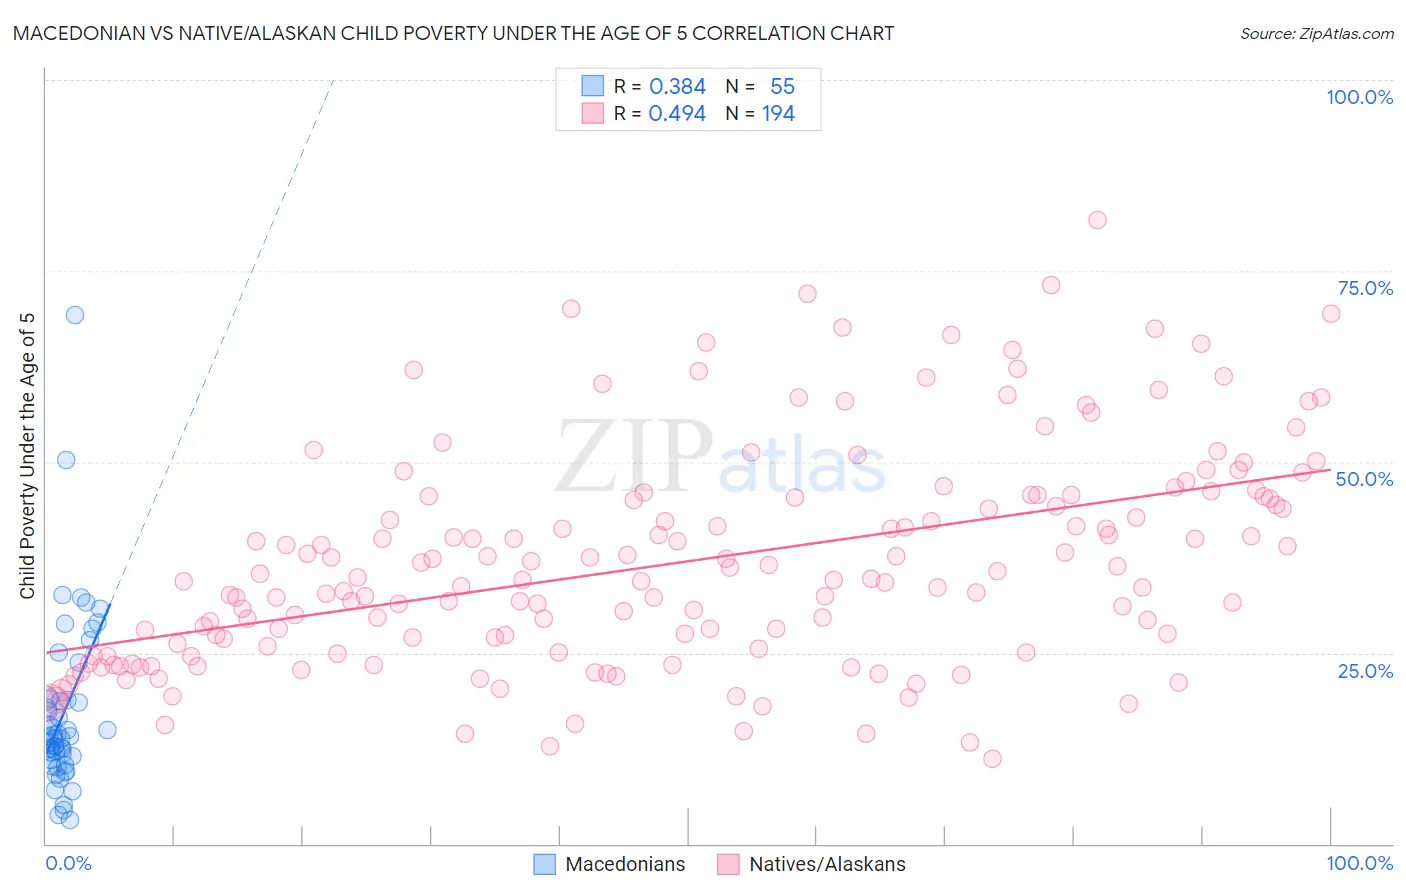
Macedonian vs Native/Alaskan Child Poverty Under the Age of 5 Correlation Chart
The statistical analysis conducted on geographies consisting of 129,119,127 people shows a mild positive correlation between the proportion of Macedonians and poverty level among children under the age of 5 in the United States with a correlation coefficient (R) of 0.384 and weighted average of 15.8%. Similarly, the statistical analysis conducted on geographies consisting of 489,584,863 people shows a moderate positive correlation between the proportion of Natives/Alaskans and poverty level among children under the age of 5 in the United States with a correlation coefficient (R) of 0.494 and weighted average of 25.6%, a difference of 61.8%.
Child Poverty Under the Age of 5 Correlation Summary
| Measurement | Macedonian | Native/Alaskan |
| Minimum | 3.1% | 11.1% |
| Maximum | 69.2% | 81.6% |
| Range | 66.1% | 70.5% |
| Mean | 17.1% | 36.9% |
| Median | 14.1% | 34.6% |
| Interquartile 25% (IQ1) | 11.0% | 25.6% |
| Interquartile 75% (IQ3) | 19.0% | 45.5% |
| Interquartile Range (IQR) | 7.9% | 19.9% |
| Standard Deviation (Sample) | 11.3% | 14.2% |
| Standard Deviation (Population) | 11.2% | 14.2% |
Similar Demographics by Child Poverty Under the Age of 5
Demographics Similar to Macedonians by Child Poverty Under the Age of 5
In terms of child poverty under the age of 5, the demographic groups most similar to Macedonians are Immigrants from Kazakhstan (15.8%, a difference of 0.040%), Immigrants from South Africa (15.8%, a difference of 0.070%), Immigrants from Switzerland (15.8%, a difference of 0.17%), Palestinian (15.8%, a difference of 0.18%), and Immigrants from Canada (15.8%, a difference of 0.20%).
| Demographics | Rating | Rank | Child Poverty Under the Age of 5 |
| Immigrants | France | 97.3 /100 | #90 | Exceptional 15.6% |
| Poles | 97.2 /100 | #91 | Exceptional 15.7% |
| Scandinavians | 97.1 /100 | #92 | Exceptional 15.7% |
| Ukrainians | 97.1 /100 | #93 | Exceptional 15.7% |
| Immigrants | South Eastern Asia | 97.1 /100 | #94 | Exceptional 15.7% |
| Immigrants | Switzerland | 96.4 /100 | #95 | Exceptional 15.8% |
| Immigrants | Kazakhstan | 96.2 /100 | #96 | Exceptional 15.8% |
| Macedonians | 96.2 /100 | #97 | Exceptional 15.8% |
| Immigrants | South Africa | 96.1 /100 | #98 | Exceptional 15.8% |
| Palestinians | 95.9 /100 | #99 | Exceptional 15.8% |
| Immigrants | Canada | 95.9 /100 | #100 | Exceptional 15.8% |
| Immigrants | Zimbabwe | 95.9 /100 | #101 | Exceptional 15.8% |
| Armenians | 95.7 /100 | #102 | Exceptional 15.8% |
| Europeans | 95.3 /100 | #103 | Exceptional 15.9% |
| Immigrants | North America | 94.9 /100 | #104 | Exceptional 15.9% |
Demographics Similar to Natives/Alaskans by Child Poverty Under the Age of 5
In terms of child poverty under the age of 5, the demographic groups most similar to Natives/Alaskans are Black/African American (25.7%, a difference of 0.50%), Colville (25.7%, a difference of 0.50%), Apache (25.0%, a difference of 2.2%), Kiowa (24.5%, a difference of 4.5%), and Sioux (26.9%, a difference of 5.4%).
| Demographics | Rating | Rank | Child Poverty Under the Age of 5 |
| Central American Indians | 0.0 /100 | #326 | Tragic 23.9% |
| Dominicans | 0.0 /100 | #327 | Tragic 24.0% |
| Immigrants | Dominican Republic | 0.0 /100 | #328 | Tragic 24.1% |
| Cajuns | 0.0 /100 | #329 | Tragic 24.1% |
| Creek | 0.0 /100 | #330 | Tragic 24.2% |
| Kiowa | 0.0 /100 | #331 | Tragic 24.5% |
| Apache | 0.0 /100 | #332 | Tragic 25.0% |
| Natives/Alaskans | 0.0 /100 | #333 | Tragic 25.6% |
| Blacks/African Americans | 0.0 /100 | #334 | Tragic 25.7% |
| Colville | 0.0 /100 | #335 | Tragic 25.7% |
| Sioux | 0.0 /100 | #336 | Tragic 26.9% |
| Pima | 0.0 /100 | #337 | Tragic 27.4% |
| Hopi | 0.0 /100 | #338 | Tragic 27.7% |
| Yup'ik | 0.0 /100 | #339 | Tragic 27.7% |
| Cheyenne | 0.0 /100 | #340 | Tragic 28.3% |