Luxembourger vs Immigrants from Netherlands Male Unemployment
COMPARE
Luxembourger
Immigrants from Netherlands
Male Unemployment
Male Unemployment Comparison
Luxembourgers
Immigrants from Netherlands
4.5%
MALE UNEMPLOYMENT
100.0/ 100
METRIC RATING
8th/ 347
METRIC RANK
5.0%
MALE UNEMPLOYMENT
98.3/ 100
METRIC RATING
59th/ 347
METRIC RANK
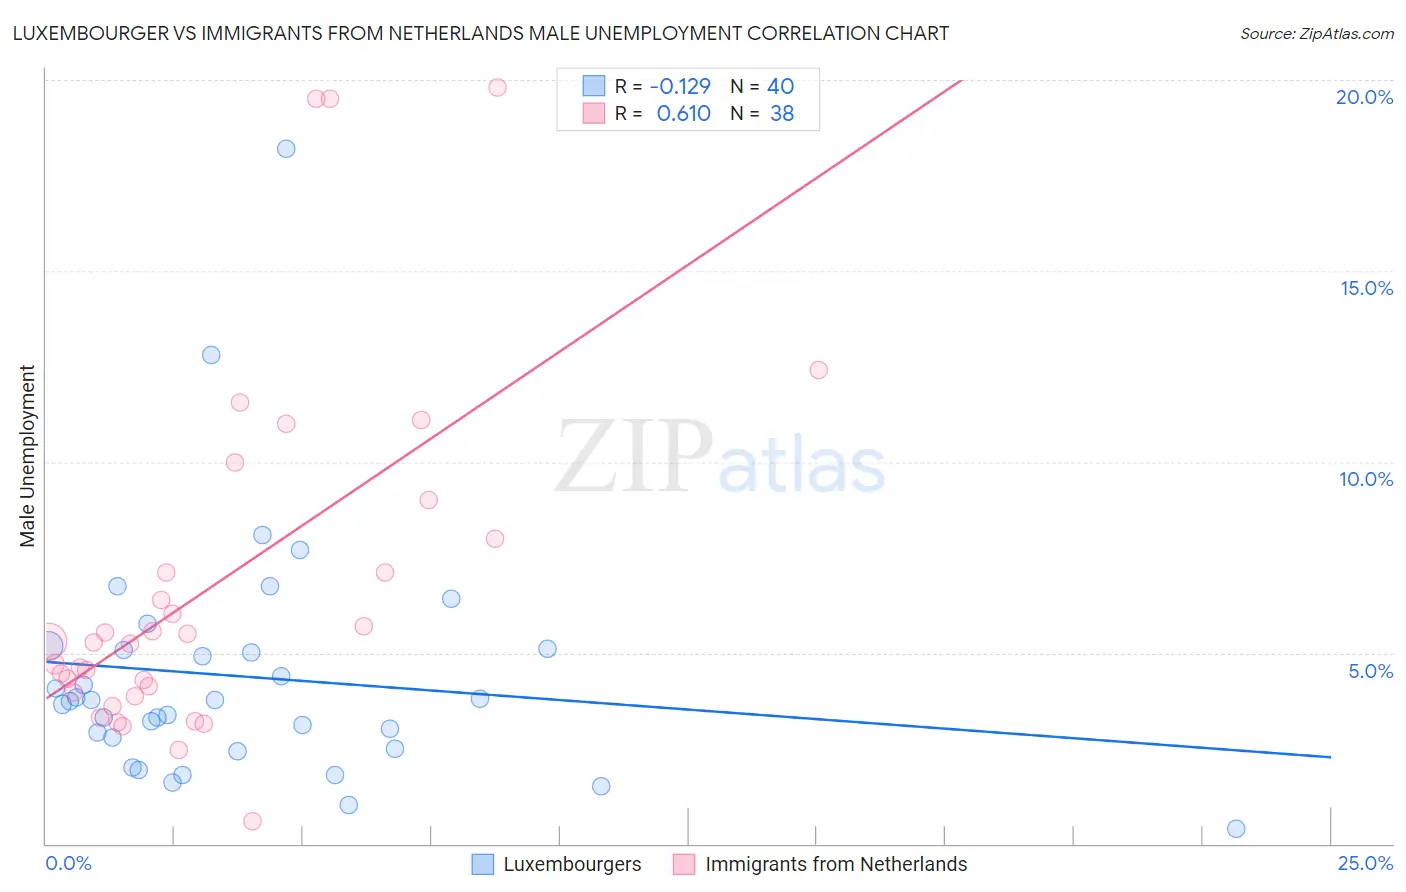
Luxembourger vs Immigrants from Netherlands Male Unemployment Correlation Chart
The statistical analysis conducted on geographies consisting of 144,259,966 people shows a poor negative correlation between the proportion of Luxembourgers and unemployment rate among males in the United States with a correlation coefficient (R) of -0.129 and weighted average of 4.5%. Similarly, the statistical analysis conducted on geographies consisting of 237,368,894 people shows a significant positive correlation between the proportion of Immigrants from Netherlands and unemployment rate among males in the United States with a correlation coefficient (R) of 0.610 and weighted average of 5.0%, a difference of 9.8%.
Male Unemployment Correlation Summary
| Measurement | Luxembourger | Immigrants from Netherlands |
| Minimum | 0.40% | 0.60% |
| Maximum | 18.2% | 19.8% |
| Range | 17.8% | 19.2% |
| Mean | 4.4% | 6.8% |
| Median | 3.8% | 5.3% |
| Interquartile 25% (IQ1) | 2.6% | 4.0% |
| Interquartile 75% (IQ3) | 5.1% | 8.0% |
| Interquartile Range (IQR) | 2.5% | 4.0% |
| Standard Deviation (Sample) | 3.2% | 4.7% |
| Standard Deviation (Population) | 3.2% | 4.6% |
Similar Demographics by Male Unemployment
Demographics Similar to Luxembourgers by Male Unemployment
In terms of male unemployment, the demographic groups most similar to Luxembourgers are Czech (4.5%, a difference of 0.26%), Venezuelan (4.5%, a difference of 0.46%), Danish (4.5%, a difference of 0.91%), Thai (4.6%, a difference of 1.2%), and Cuban (4.6%, a difference of 1.8%).
| Demographics | Rating | Rank | Male Unemployment |
| Immigrants | India | 100.0 /100 | #1 | Exceptional 4.4% |
| Immigrants | Cuba | 100.0 /100 | #2 | Exceptional 4.4% |
| Norwegians | 100.0 /100 | #3 | Exceptional 4.4% |
| Immigrants | Venezuela | 100.0 /100 | #4 | Exceptional 4.4% |
| Danes | 100.0 /100 | #5 | Exceptional 4.5% |
| Venezuelans | 100.0 /100 | #6 | Exceptional 4.5% |
| Czechs | 100.0 /100 | #7 | Exceptional 4.5% |
| Luxembourgers | 100.0 /100 | #8 | Exceptional 4.5% |
| Thais | 100.0 /100 | #9 | Exceptional 4.6% |
| Cubans | 100.0 /100 | #10 | Exceptional 4.6% |
| Swedes | 100.0 /100 | #11 | Exceptional 4.6% |
| Immigrants | Bolivia | 100.0 /100 | #12 | Exceptional 4.7% |
| Bolivians | 100.0 /100 | #13 | Exceptional 4.7% |
| Germans | 100.0 /100 | #14 | Exceptional 4.7% |
| Scandinavians | 100.0 /100 | #15 | Exceptional 4.7% |
Demographics Similar to Immigrants from Netherlands by Male Unemployment
In terms of male unemployment, the demographic groups most similar to Immigrants from Netherlands are Turkish (5.0%, a difference of 0.14%), Lithuanian (5.0%, a difference of 0.14%), Immigrants from Argentina (5.0%, a difference of 0.18%), Cambodian (5.0%, a difference of 0.26%), and Immigrants from Bulgaria (5.0%, a difference of 0.37%).
| Demographics | Rating | Rank | Male Unemployment |
| Irish | 98.8 /100 | #52 | Exceptional 5.0% |
| Jordanians | 98.8 /100 | #53 | Exceptional 5.0% |
| Yugoslavians | 98.7 /100 | #54 | Exceptional 5.0% |
| Czechoslovakians | 98.7 /100 | #55 | Exceptional 5.0% |
| Immigrants | Bulgaria | 98.7 /100 | #56 | Exceptional 5.0% |
| Turks | 98.5 /100 | #57 | Exceptional 5.0% |
| Lithuanians | 98.5 /100 | #58 | Exceptional 5.0% |
| Immigrants | Netherlands | 98.3 /100 | #59 | Exceptional 5.0% |
| Immigrants | Argentina | 98.1 /100 | #60 | Exceptional 5.0% |
| Cambodians | 98.1 /100 | #61 | Exceptional 5.0% |
| Basques | 97.9 /100 | #62 | Exceptional 5.0% |
| Eastern Europeans | 97.9 /100 | #63 | Exceptional 5.0% |
| Celtics | 97.8 /100 | #64 | Exceptional 5.0% |
| Icelanders | 97.6 /100 | #65 | Exceptional 5.0% |
| Finns | 97.5 /100 | #66 | Exceptional 5.0% |