Slovak vs Immigrants from Netherlands Single Male Poverty
COMPARE
Slovak
Immigrants from Netherlands
Single Male Poverty
Single Male Poverty Comparison
Slovaks
Immigrants from Netherlands
14.1%
SINGLE MALE POVERTY
0.0/ 100
METRIC RATING
278th/ 347
METRIC RANK
12.5%
SINGLE MALE POVERTY
86.2/ 100
METRIC RATING
127th/ 347
METRIC RANK
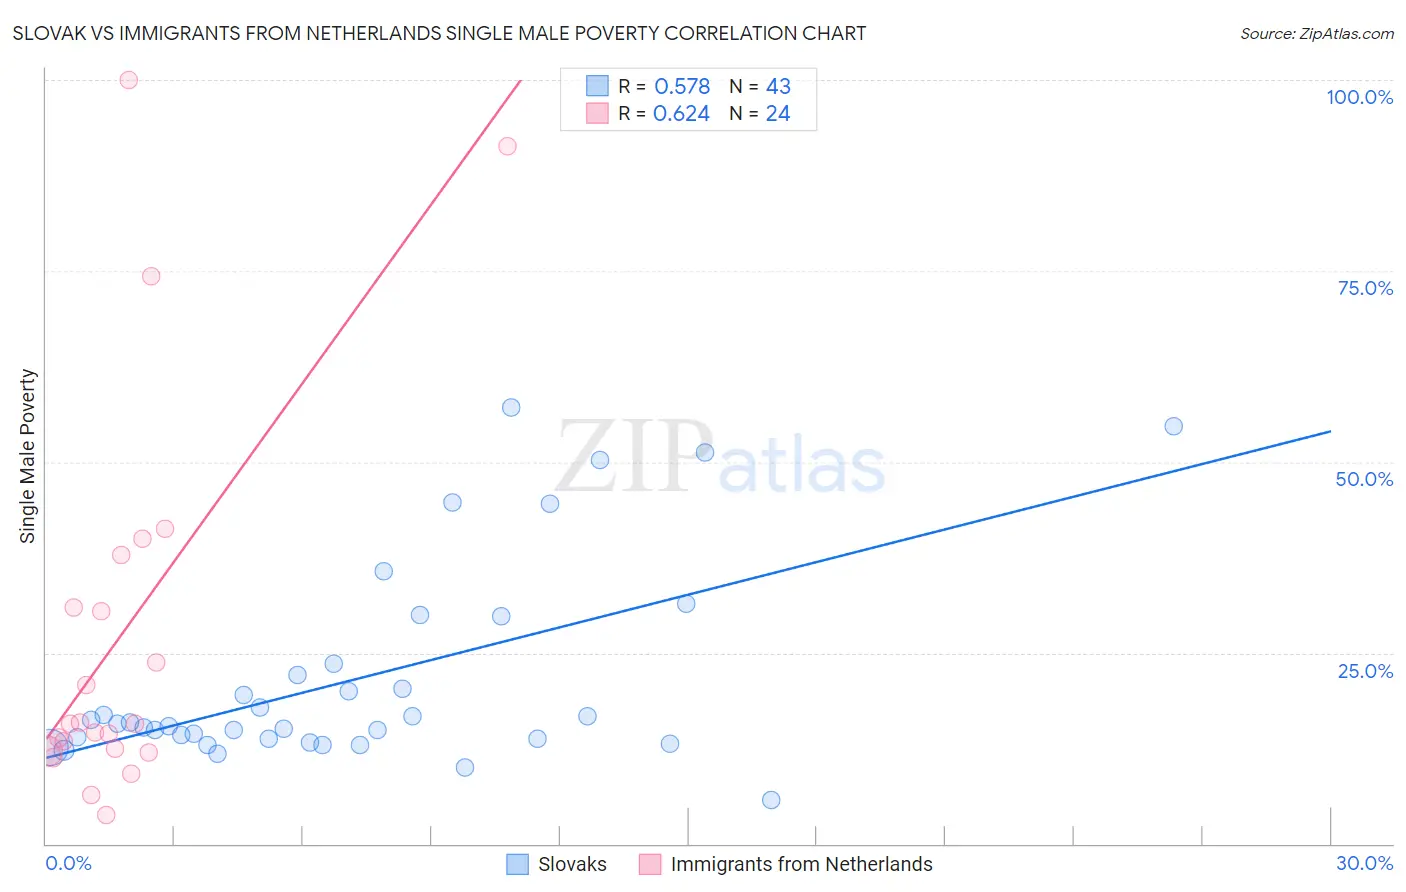
Slovak vs Immigrants from Netherlands Single Male Poverty Correlation Chart
The statistical analysis conducted on geographies consisting of 343,124,767 people shows a substantial positive correlation between the proportion of Slovaks and poverty level among single males in the United States with a correlation coefficient (R) of 0.578 and weighted average of 14.1%. Similarly, the statistical analysis conducted on geographies consisting of 216,285,170 people shows a significant positive correlation between the proportion of Immigrants from Netherlands and poverty level among single males in the United States with a correlation coefficient (R) of 0.624 and weighted average of 12.5%, a difference of 12.8%.
Single Male Poverty Correlation Summary
| Measurement | Slovak | Immigrants from Netherlands |
| Minimum | 5.7% | 3.8% |
| Maximum | 57.1% | 100.0% |
| Range | 51.4% | 96.2% |
| Mean | 21.6% | 27.6% |
| Median | 15.7% | 15.7% |
| Interquartile 25% (IQ1) | 13.8% | 12.3% |
| Interquartile 75% (IQ3) | 23.6% | 34.4% |
| Interquartile Range (IQR) | 9.9% | 22.1% |
| Standard Deviation (Sample) | 13.2% | 26.0% |
| Standard Deviation (Population) | 13.0% | 25.4% |
Similar Demographics by Single Male Poverty
Demographics Similar to Slovaks by Single Male Poverty
In terms of single male poverty, the demographic groups most similar to Slovaks are Indonesian (14.1%, a difference of 0.040%), Immigrants from Honduras (14.1%, a difference of 0.060%), Dutch (14.1%, a difference of 0.10%), English (14.1%, a difference of 0.22%), and Honduran (14.0%, a difference of 0.30%).
| Demographics | Rating | Rank | Single Male Poverty |
| Irish | 0.1 /100 | #271 | Tragic 14.0% |
| Mexicans | 0.1 /100 | #272 | Tragic 14.0% |
| Welsh | 0.1 /100 | #273 | Tragic 14.0% |
| Hondurans | 0.1 /100 | #274 | Tragic 14.0% |
| English | 0.1 /100 | #275 | Tragic 14.1% |
| Dutch | 0.1 /100 | #276 | Tragic 14.1% |
| Immigrants | Honduras | 0.0 /100 | #277 | Tragic 14.1% |
| Slovaks | 0.0 /100 | #278 | Tragic 14.1% |
| Indonesians | 0.0 /100 | #279 | Tragic 14.1% |
| Hmong | 0.0 /100 | #280 | Tragic 14.2% |
| Hispanics or Latinos | 0.0 /100 | #281 | Tragic 14.2% |
| Spanish Americans | 0.0 /100 | #282 | Tragic 14.2% |
| Yaqui | 0.0 /100 | #283 | Tragic 14.2% |
| Immigrants | Bahamas | 0.0 /100 | #284 | Tragic 14.4% |
| French | 0.0 /100 | #285 | Tragic 14.4% |
Demographics Similar to Immigrants from Netherlands by Single Male Poverty
In terms of single male poverty, the demographic groups most similar to Immigrants from Netherlands are Romanian (12.5%, a difference of 0.010%), Ecuadorian (12.5%, a difference of 0.040%), Immigrants from Sierra Leone (12.5%, a difference of 0.080%), Immigrants from Jordan (12.5%, a difference of 0.10%), and Russian (12.5%, a difference of 0.13%).
| Demographics | Rating | Rank | Single Male Poverty |
| Venezuelans | 89.4 /100 | #120 | Excellent 12.4% |
| Icelanders | 88.2 /100 | #121 | Excellent 12.5% |
| Serbians | 87.9 /100 | #122 | Excellent 12.5% |
| Immigrants | Kenya | 87.6 /100 | #123 | Excellent 12.5% |
| Russians | 87.3 /100 | #124 | Excellent 12.5% |
| Immigrants | Jordan | 87.1 /100 | #125 | Excellent 12.5% |
| Romanians | 86.4 /100 | #126 | Excellent 12.5% |
| Immigrants | Netherlands | 86.2 /100 | #127 | Excellent 12.5% |
| Ecuadorians | 85.9 /100 | #128 | Excellent 12.5% |
| Immigrants | Sierra Leone | 85.5 /100 | #129 | Excellent 12.5% |
| Immigrants | Nicaragua | 84.8 /100 | #130 | Excellent 12.5% |
| Immigrants | Northern Europe | 83.7 /100 | #131 | Excellent 12.5% |
| Salvadorans | 83.7 /100 | #132 | Excellent 12.5% |
| Immigrants | Western Asia | 83.4 /100 | #133 | Excellent 12.5% |
| Immigrants | Ecuador | 82.1 /100 | #134 | Excellent 12.5% |