Nicaraguan vs Immigrants from Netherlands Single Male Poverty
COMPARE
Nicaraguan
Immigrants from Netherlands
Single Male Poverty
Single Male Poverty Comparison
Nicaraguans
Immigrants from Netherlands
12.4%
SINGLE MALE POVERTY
92.1/ 100
METRIC RATING
114th/ 347
METRIC RANK
12.5%
SINGLE MALE POVERTY
86.2/ 100
METRIC RATING
127th/ 347
METRIC RANK
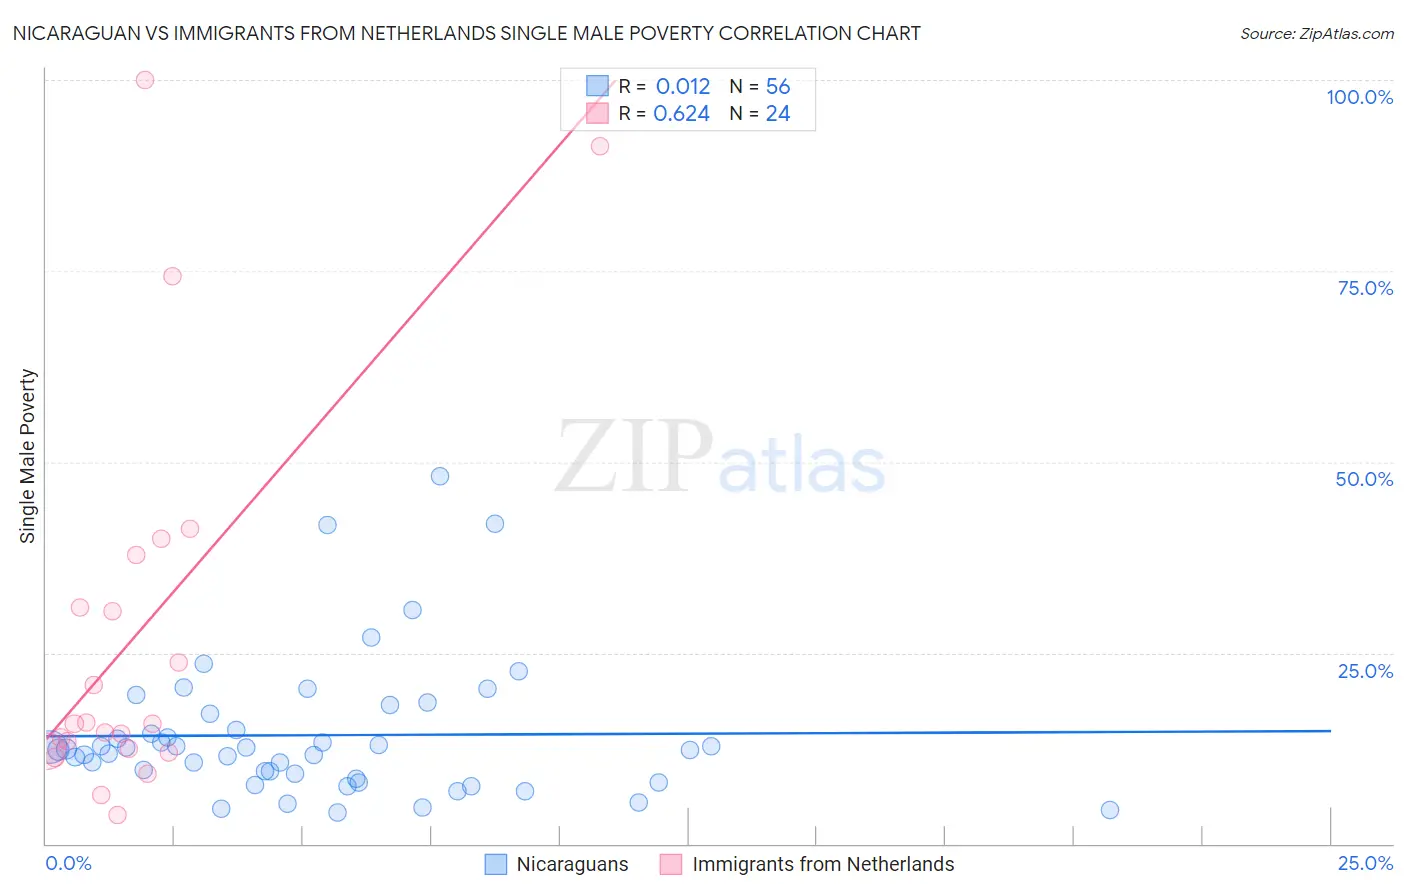
Nicaraguan vs Immigrants from Netherlands Single Male Poverty Correlation Chart
The statistical analysis conducted on geographies consisting of 265,372,513 people shows no correlation between the proportion of Nicaraguans and poverty level among single males in the United States with a correlation coefficient (R) of 0.012 and weighted average of 12.4%. Similarly, the statistical analysis conducted on geographies consisting of 216,285,170 people shows a significant positive correlation between the proportion of Immigrants from Netherlands and poverty level among single males in the United States with a correlation coefficient (R) of 0.624 and weighted average of 12.5%, a difference of 0.85%.
Single Male Poverty Correlation Summary
| Measurement | Nicaraguan | Immigrants from Netherlands |
| Minimum | 4.1% | 3.8% |
| Maximum | 48.1% | 100.0% |
| Range | 44.0% | 96.2% |
| Mean | 14.2% | 27.6% |
| Median | 12.4% | 15.7% |
| Interquartile 25% (IQ1) | 8.9% | 12.3% |
| Interquartile 75% (IQ3) | 16.0% | 34.4% |
| Interquartile Range (IQR) | 7.1% | 22.1% |
| Standard Deviation (Sample) | 9.1% | 26.0% |
| Standard Deviation (Population) | 9.0% | 25.4% |
Demographics Similar to Nicaraguans and Immigrants from Netherlands by Single Male Poverty
In terms of single male poverty, the demographic groups most similar to Nicaraguans are Pakistani (12.4%, a difference of 0.050%), Immigrants from Southern Europe (12.4%, a difference of 0.11%), Immigrants from Syria (12.4%, a difference of 0.16%), Immigrants from Oceania (12.4%, a difference of 0.18%), and Kenyan (12.4%, a difference of 0.23%). Similarly, the demographic groups most similar to Immigrants from Netherlands are Romanian (12.5%, a difference of 0.010%), Ecuadorian (12.5%, a difference of 0.040%), Immigrants from Sierra Leone (12.5%, a difference of 0.080%), Immigrants from Jordan (12.5%, a difference of 0.10%), and Russian (12.5%, a difference of 0.13%).
| Demographics | Rating | Rank | Single Male Poverty |
| Immigrants | Portugal | 93.6 /100 | #110 | Exceptional 12.3% |
| Immigrants | North Macedonia | 93.6 /100 | #111 | Exceptional 12.3% |
| Kenyans | 93.3 /100 | #112 | Exceptional 12.4% |
| Pakistanis | 92.4 /100 | #113 | Exceptional 12.4% |
| Nicaraguans | 92.1 /100 | #114 | Exceptional 12.4% |
| Immigrants | Southern Europe | 91.5 /100 | #115 | Exceptional 12.4% |
| Immigrants | Syria | 91.2 /100 | #116 | Exceptional 12.4% |
| Immigrants | Oceania | 91.1 /100 | #117 | Exceptional 12.4% |
| Albanians | 90.6 /100 | #118 | Exceptional 12.4% |
| Immigrants | Albania | 90.3 /100 | #119 | Exceptional 12.4% |
| Venezuelans | 89.4 /100 | #120 | Excellent 12.4% |
| Icelanders | 88.2 /100 | #121 | Excellent 12.5% |
| Serbians | 87.9 /100 | #122 | Excellent 12.5% |
| Immigrants | Kenya | 87.6 /100 | #123 | Excellent 12.5% |
| Russians | 87.3 /100 | #124 | Excellent 12.5% |
| Immigrants | Jordan | 87.1 /100 | #125 | Excellent 12.5% |
| Romanians | 86.4 /100 | #126 | Excellent 12.5% |
| Immigrants | Netherlands | 86.2 /100 | #127 | Excellent 12.5% |
| Ecuadorians | 85.9 /100 | #128 | Excellent 12.5% |
| Immigrants | Sierra Leone | 85.5 /100 | #129 | Excellent 12.5% |
| Immigrants | Nicaragua | 84.8 /100 | #130 | Excellent 12.5% |