Korean vs Immigrants from Netherlands Single Male Poverty
COMPARE
Korean
Immigrants from Netherlands
Single Male Poverty
Single Male Poverty Comparison
Koreans
Immigrants from Netherlands
11.0%
SINGLE MALE POVERTY
100.0/ 100
METRIC RATING
15th/ 347
METRIC RANK
12.5%
SINGLE MALE POVERTY
86.2/ 100
METRIC RATING
127th/ 347
METRIC RANK
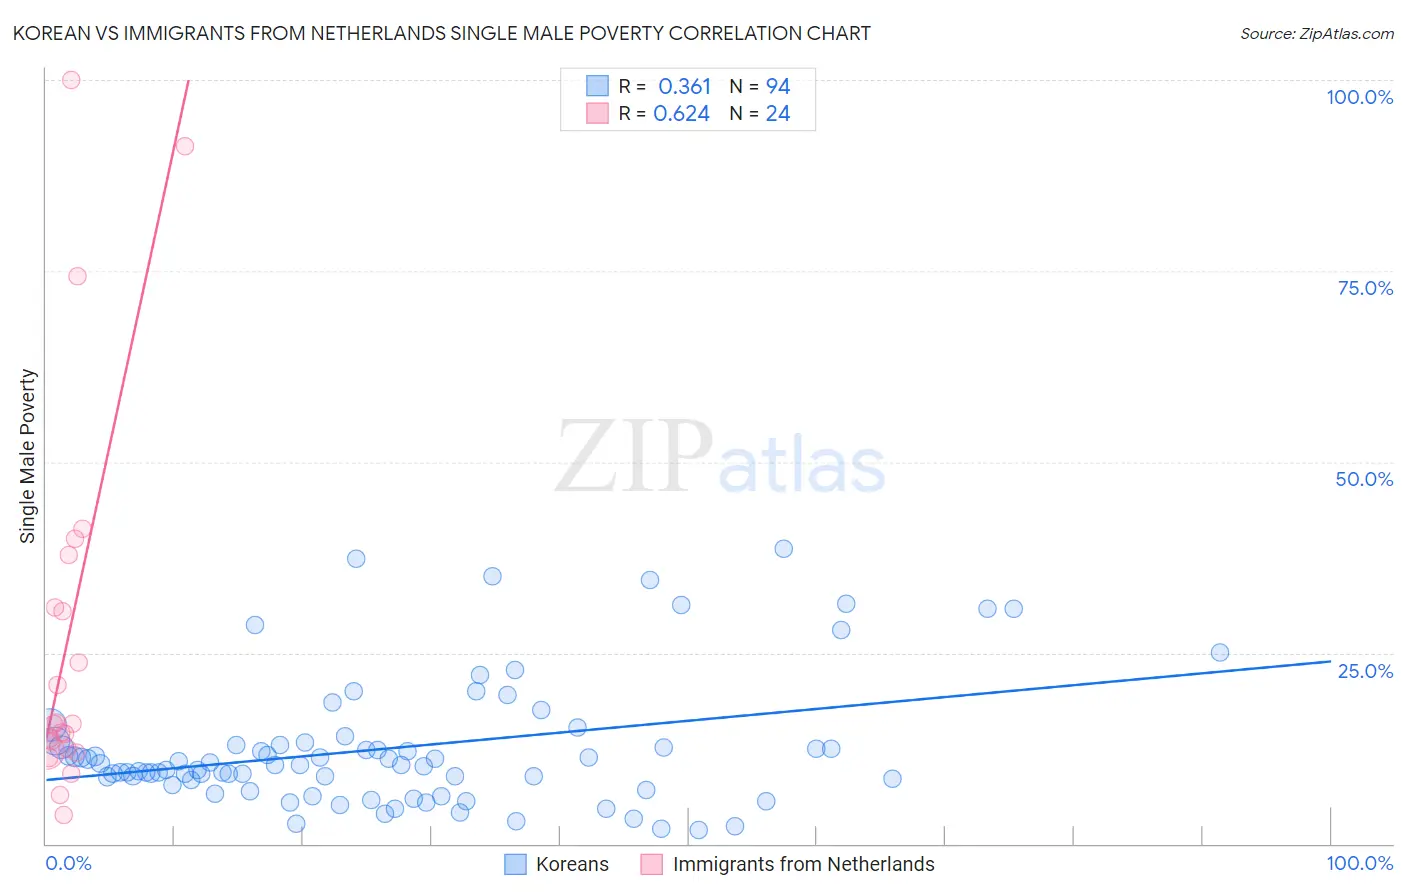
Korean vs Immigrants from Netherlands Single Male Poverty Correlation Chart
The statistical analysis conducted on geographies consisting of 437,940,785 people shows a mild positive correlation between the proportion of Koreans and poverty level among single males in the United States with a correlation coefficient (R) of 0.361 and weighted average of 11.0%. Similarly, the statistical analysis conducted on geographies consisting of 216,285,170 people shows a significant positive correlation between the proportion of Immigrants from Netherlands and poverty level among single males in the United States with a correlation coefficient (R) of 0.624 and weighted average of 12.5%, a difference of 13.7%.
Single Male Poverty Correlation Summary
| Measurement | Korean | Immigrants from Netherlands |
| Minimum | 1.9% | 3.8% |
| Maximum | 38.6% | 100.0% |
| Range | 36.8% | 96.2% |
| Mean | 12.5% | 27.6% |
| Median | 10.3% | 15.7% |
| Interquartile 25% (IQ1) | 8.4% | 12.3% |
| Interquartile 75% (IQ3) | 13.0% | 34.4% |
| Interquartile Range (IQR) | 4.6% | 22.1% |
| Standard Deviation (Sample) | 8.3% | 26.0% |
| Standard Deviation (Population) | 8.3% | 25.4% |
Similar Demographics by Single Male Poverty
Demographics Similar to Koreans by Single Male Poverty
In terms of single male poverty, the demographic groups most similar to Koreans are Chinese (11.0%, a difference of 0.050%), Immigrants from South Central Asia (10.9%, a difference of 0.62%), Immigrants from Afghanistan (10.9%, a difference of 0.74%), Bhutanese (11.1%, a difference of 0.75%), and Immigrants from Philippines (10.9%, a difference of 0.82%).
| Demographics | Rating | Rank | Single Male Poverty |
| Thais | 100.0 /100 | #8 | Exceptional 10.8% |
| Taiwanese | 100.0 /100 | #9 | Exceptional 10.9% |
| Immigrants | Fiji | 100.0 /100 | #10 | Exceptional 10.9% |
| Immigrants | Philippines | 100.0 /100 | #11 | Exceptional 10.9% |
| Immigrants | Afghanistan | 100.0 /100 | #12 | Exceptional 10.9% |
| Immigrants | South Central Asia | 100.0 /100 | #13 | Exceptional 10.9% |
| Chinese | 100.0 /100 | #14 | Exceptional 11.0% |
| Koreans | 100.0 /100 | #15 | Exceptional 11.0% |
| Bhutanese | 100.0 /100 | #16 | Exceptional 11.1% |
| Tsimshian | 100.0 /100 | #17 | Exceptional 11.1% |
| Immigrants | Bolivia | 100.0 /100 | #18 | Exceptional 11.1% |
| Immigrants | Moldova | 100.0 /100 | #19 | Exceptional 11.2% |
| Ethiopians | 100.0 /100 | #20 | Exceptional 11.2% |
| Asians | 100.0 /100 | #21 | Exceptional 11.2% |
| Immigrants | Pakistan | 100.0 /100 | #22 | Exceptional 11.2% |
Demographics Similar to Immigrants from Netherlands by Single Male Poverty
In terms of single male poverty, the demographic groups most similar to Immigrants from Netherlands are Romanian (12.5%, a difference of 0.010%), Ecuadorian (12.5%, a difference of 0.040%), Immigrants from Sierra Leone (12.5%, a difference of 0.080%), Immigrants from Jordan (12.5%, a difference of 0.10%), and Russian (12.5%, a difference of 0.13%).
| Demographics | Rating | Rank | Single Male Poverty |
| Venezuelans | 89.4 /100 | #120 | Excellent 12.4% |
| Icelanders | 88.2 /100 | #121 | Excellent 12.5% |
| Serbians | 87.9 /100 | #122 | Excellent 12.5% |
| Immigrants | Kenya | 87.6 /100 | #123 | Excellent 12.5% |
| Russians | 87.3 /100 | #124 | Excellent 12.5% |
| Immigrants | Jordan | 87.1 /100 | #125 | Excellent 12.5% |
| Romanians | 86.4 /100 | #126 | Excellent 12.5% |
| Immigrants | Netherlands | 86.2 /100 | #127 | Excellent 12.5% |
| Ecuadorians | 85.9 /100 | #128 | Excellent 12.5% |
| Immigrants | Sierra Leone | 85.5 /100 | #129 | Excellent 12.5% |
| Immigrants | Nicaragua | 84.8 /100 | #130 | Excellent 12.5% |
| Immigrants | Northern Europe | 83.7 /100 | #131 | Excellent 12.5% |
| Salvadorans | 83.7 /100 | #132 | Excellent 12.5% |
| Immigrants | Western Asia | 83.4 /100 | #133 | Excellent 12.5% |
| Immigrants | Ecuador | 82.1 /100 | #134 | Excellent 12.5% |