Luxembourger vs Immigrants from Netherlands Family Households with Children
COMPARE
Luxembourger
Immigrants from Netherlands
Family Households with Children
Family Households with Children Comparison
Luxembourgers
Immigrants from Netherlands
27.0%
FAMILY HOUSEHOLDS WITH CHILDREN
5.5/ 100
METRIC RATING
231st/ 347
METRIC RANK
26.9%
FAMILY HOUSEHOLDS WITH CHILDREN
3.5/ 100
METRIC RATING
237th/ 347
METRIC RANK
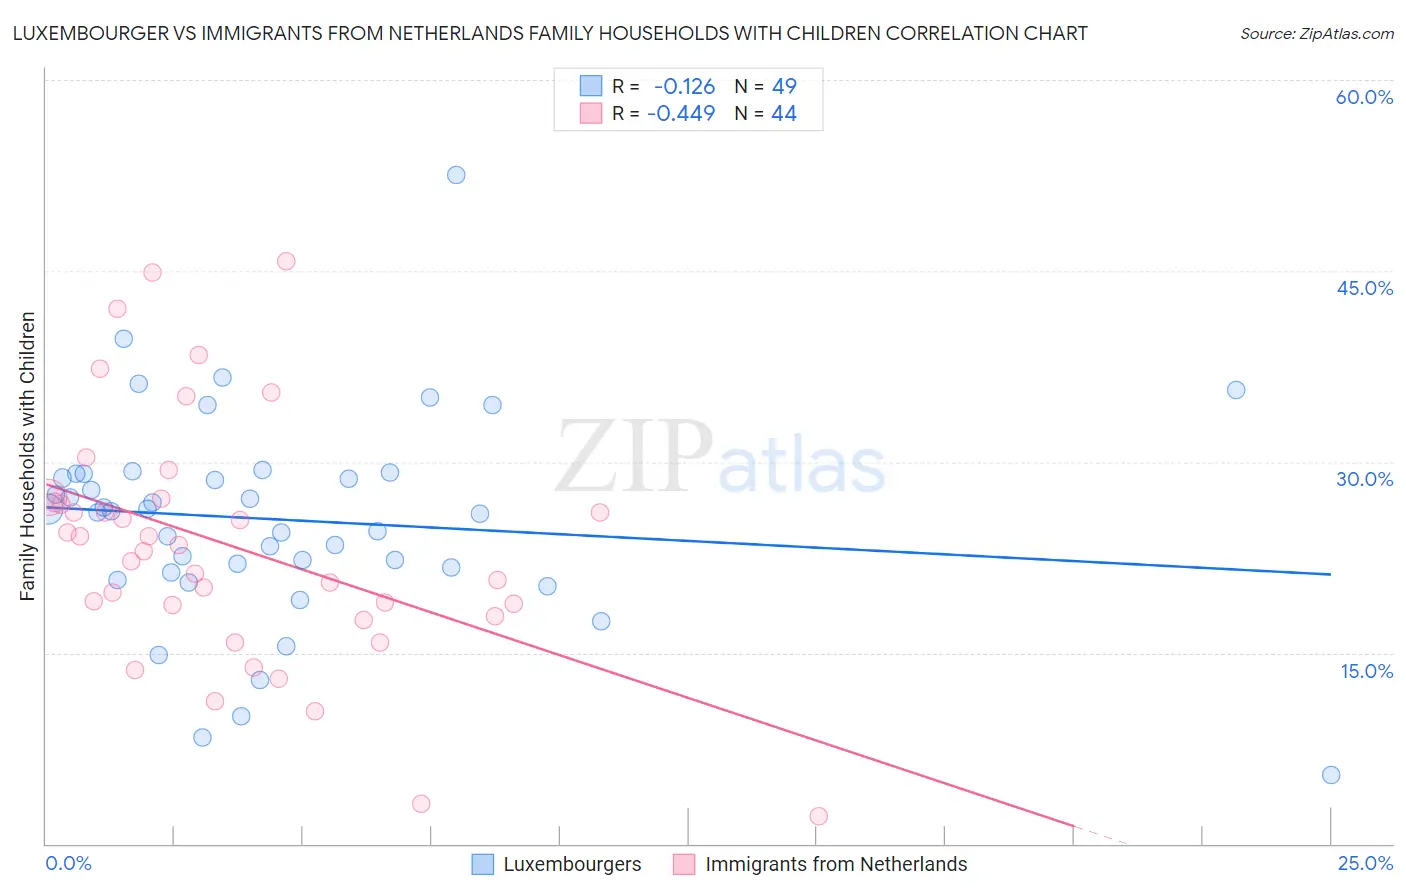
Luxembourger vs Immigrants from Netherlands Family Households with Children Correlation Chart
The statistical analysis conducted on geographies consisting of 144,627,204 people shows a poor negative correlation between the proportion of Luxembourgers and percentage of family households with children in the United States with a correlation coefficient (R) of -0.126 and weighted average of 27.0%. Similarly, the statistical analysis conducted on geographies consisting of 237,672,305 people shows a moderate negative correlation between the proportion of Immigrants from Netherlands and percentage of family households with children in the United States with a correlation coefficient (R) of -0.449 and weighted average of 26.9%, a difference of 0.27%.
Family Households with Children Correlation Summary
| Measurement | Luxembourger | Immigrants from Netherlands |
| Minimum | 5.4% | 2.1% |
| Maximum | 52.5% | 45.8% |
| Range | 47.1% | 43.7% |
| Mean | 25.5% | 23.4% |
| Median | 26.1% | 23.2% |
| Interquartile 25% (IQ1) | 21.5% | 18.3% |
| Interquartile 75% (IQ3) | 29.1% | 27.0% |
| Interquartile Range (IQR) | 7.6% | 8.7% |
| Standard Deviation (Sample) | 8.2% | 9.6% |
| Standard Deviation (Population) | 8.1% | 9.5% |
Demographics Similar to Luxembourgers and Immigrants from Netherlands by Family Households with Children
In terms of family households with children, the demographic groups most similar to Luxembourgers are Bulgarian (27.0%, a difference of 0.030%), Yugoslavian (27.0%, a difference of 0.050%), Immigrants from Italy (27.0%, a difference of 0.050%), Immigrants from Caribbean (27.0%, a difference of 0.080%), and Scottish (27.0%, a difference of 0.10%). Similarly, the demographic groups most similar to Immigrants from Netherlands are Moroccan (26.9%, a difference of 0.010%), Cape Verdean (26.9%, a difference of 0.020%), Immigrants from Southern Europe (26.9%, a difference of 0.020%), Immigrants from Bulgaria (26.9%, a difference of 0.030%), and Navajo (26.9%, a difference of 0.040%).
| Demographics | Rating | Rank | Family Households with Children |
| Germans | 8.7 /100 | #224 | Tragic 27.1% |
| Canadians | 7.5 /100 | #225 | Tragic 27.1% |
| Czechoslovakians | 6.6 /100 | #226 | Tragic 27.0% |
| Tsimshian | 6.6 /100 | #227 | Tragic 27.0% |
| Scottish | 6.5 /100 | #228 | Tragic 27.0% |
| Immigrants | Caribbean | 6.3 /100 | #229 | Tragic 27.0% |
| Bulgarians | 5.8 /100 | #230 | Tragic 27.0% |
| Luxembourgers | 5.5 /100 | #231 | Tragic 27.0% |
| Yugoslavians | 5.1 /100 | #232 | Tragic 27.0% |
| Immigrants | Italy | 5.0 /100 | #233 | Tragic 27.0% |
| Immigrants | Germany | 4.4 /100 | #234 | Tragic 27.0% |
| Immigrants | Morocco | 4.2 /100 | #235 | Tragic 27.0% |
| Cape Verdeans | 3.6 /100 | #236 | Tragic 26.9% |
| Immigrants | Netherlands | 3.5 /100 | #237 | Tragic 26.9% |
| Moroccans | 3.4 /100 | #238 | Tragic 26.9% |
| Immigrants | Southern Europe | 3.4 /100 | #239 | Tragic 26.9% |
| Immigrants | Bulgaria | 3.3 /100 | #240 | Tragic 26.9% |
| Navajo | 3.2 /100 | #241 | Tragic 26.9% |
| Immigrants | England | 3.2 /100 | #242 | Tragic 26.9% |
| Immigrants | Saudi Arabia | 2.9 /100 | #243 | Tragic 26.9% |
| Ukrainians | 2.9 /100 | #244 | Tragic 26.9% |