Lumbee vs Seminole Disability Age Over 75
COMPARE
Lumbee
Seminole
Disability Age Over 75
Disability Age Over 75 Comparison
Lumbee
Seminole
56.2%
DISABILITY AGE OVER 75
0.0/ 100
METRIC RATING
342nd/ 347
METRIC RANK
51.5%
DISABILITY AGE OVER 75
0.0/ 100
METRIC RATING
318th/ 347
METRIC RANK
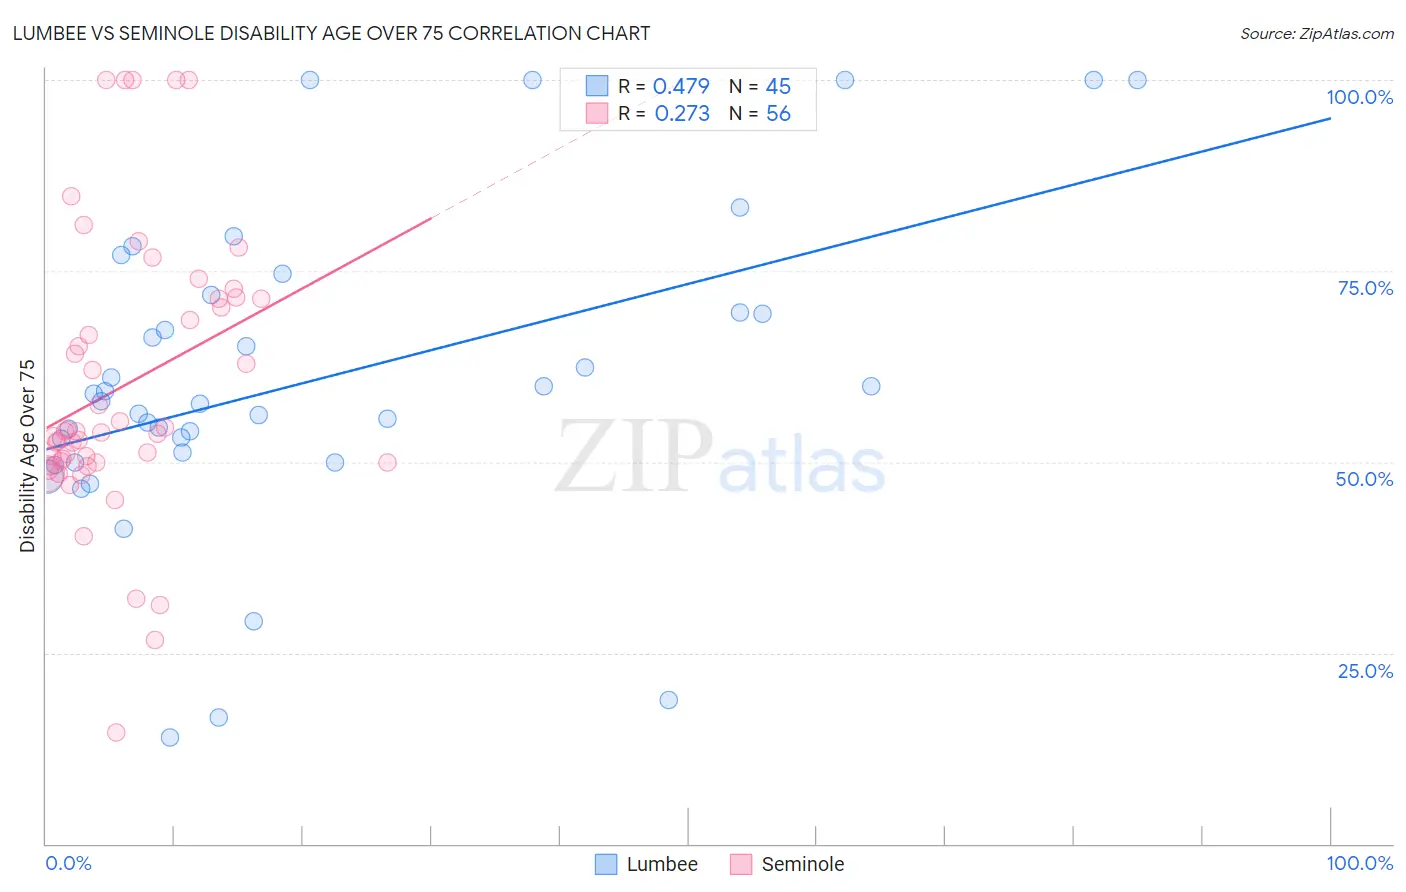
Lumbee vs Seminole Disability Age Over 75 Correlation Chart
The statistical analysis conducted on geographies consisting of 92,131,949 people shows a moderate positive correlation between the proportion of Lumbee and percentage of population with a disability over the age of 75 in the United States with a correlation coefficient (R) of 0.479 and weighted average of 56.2%. Similarly, the statistical analysis conducted on geographies consisting of 118,267,325 people shows a weak positive correlation between the proportion of Seminole and percentage of population with a disability over the age of 75 in the United States with a correlation coefficient (R) of 0.273 and weighted average of 51.5%, a difference of 9.3%.
Disability Age Over 75 Correlation Summary
| Measurement | Lumbee | Seminole |
| Minimum | 13.8% | 14.6% |
| Maximum | 100.0% | 100.0% |
| Range | 86.2% | 85.4% |
| Mean | 60.7% | 59.9% |
| Median | 58.0% | 53.9% |
| Interquartile 25% (IQ1) | 50.6% | 50.0% |
| Interquartile 75% (IQ3) | 70.7% | 71.4% |
| Interquartile Range (IQR) | 20.1% | 21.4% |
| Standard Deviation (Sample) | 20.4% | 18.4% |
| Standard Deviation (Population) | 20.2% | 18.2% |
Similar Demographics by Disability Age Over 75
Demographics Similar to Lumbee by Disability Age Over 75
In terms of disability age over 75, the demographic groups most similar to Lumbee are Houma (56.2%, a difference of 0.16%), Pueblo (55.9%, a difference of 0.67%), Pima (55.8%, a difference of 0.76%), Tohono O'odham (56.7%, a difference of 0.83%), and Colville (55.4%, a difference of 1.6%).
| Demographics | Rating | Rank | Disability Age Over 75 |
| Apache | 0.0 /100 | #333 | Tragic 53.6% |
| Alaskan Athabascans | 0.0 /100 | #334 | Tragic 54.0% |
| Kiowa | 0.0 /100 | #335 | Tragic 54.2% |
| Immigrants | Armenia | 0.0 /100 | #336 | Tragic 54.3% |
| Yuman | 0.0 /100 | #337 | Tragic 54.4% |
| Colville | 0.0 /100 | #338 | Tragic 55.4% |
| Pima | 0.0 /100 | #339 | Tragic 55.8% |
| Pueblo | 0.0 /100 | #340 | Tragic 55.9% |
| Houma | 0.0 /100 | #341 | Tragic 56.2% |
| Lumbee | 0.0 /100 | #342 | Tragic 56.2% |
| Tohono O'odham | 0.0 /100 | #343 | Tragic 56.7% |
| Navajo | 0.0 /100 | #344 | Tragic 58.3% |
| Inupiat | 0.0 /100 | #345 | Tragic 58.4% |
| Tsimshian | 0.0 /100 | #346 | Tragic 59.2% |
| Yup'ik | 0.0 /100 | #347 | Tragic 61.1% |
Demographics Similar to Seminole by Disability Age Over 75
In terms of disability age over 75, the demographic groups most similar to Seminole are Creek (51.5%, a difference of 0.0%), Paiute (51.5%, a difference of 0.14%), Dutch West Indian (51.5%, a difference of 0.15%), Yakama (51.3%, a difference of 0.33%), and Comanche (51.7%, a difference of 0.49%).
| Demographics | Rating | Rank | Disability Age Over 75 |
| Cajuns | 0.0 /100 | #311 | Tragic 50.7% |
| Cheyenne | 0.0 /100 | #312 | Tragic 50.9% |
| Immigrants | Azores | 0.0 /100 | #313 | Tragic 50.9% |
| Immigrants | Mexico | 0.0 /100 | #314 | Tragic 51.1% |
| Mexicans | 0.0 /100 | #315 | Tragic 51.1% |
| Chickasaw | 0.0 /100 | #316 | Tragic 51.2% |
| Yakama | 0.0 /100 | #317 | Tragic 51.3% |
| Seminole | 0.0 /100 | #318 | Tragic 51.5% |
| Creek | 0.0 /100 | #319 | Tragic 51.5% |
| Paiute | 0.0 /100 | #320 | Tragic 51.5% |
| Dutch West Indians | 0.0 /100 | #321 | Tragic 51.5% |
| Comanche | 0.0 /100 | #322 | Tragic 51.7% |
| Immigrants | Yemen | 0.0 /100 | #323 | Tragic 52.0% |
| Menominee | 0.0 /100 | #324 | Tragic 52.3% |
| Immigrants | Cabo Verde | 0.0 /100 | #325 | Tragic 52.4% |