Immigrants from Guyana vs Seminole Poverty
COMPARE
Immigrants from Guyana
Seminole
Poverty
Poverty Comparison
Immigrants from Guyana
Seminole
14.5%
POVERTY
0.1/ 100
METRIC RATING
265th/ 347
METRIC RANK
15.6%
POVERTY
0.0/ 100
METRIC RATING
309th/ 347
METRIC RANK
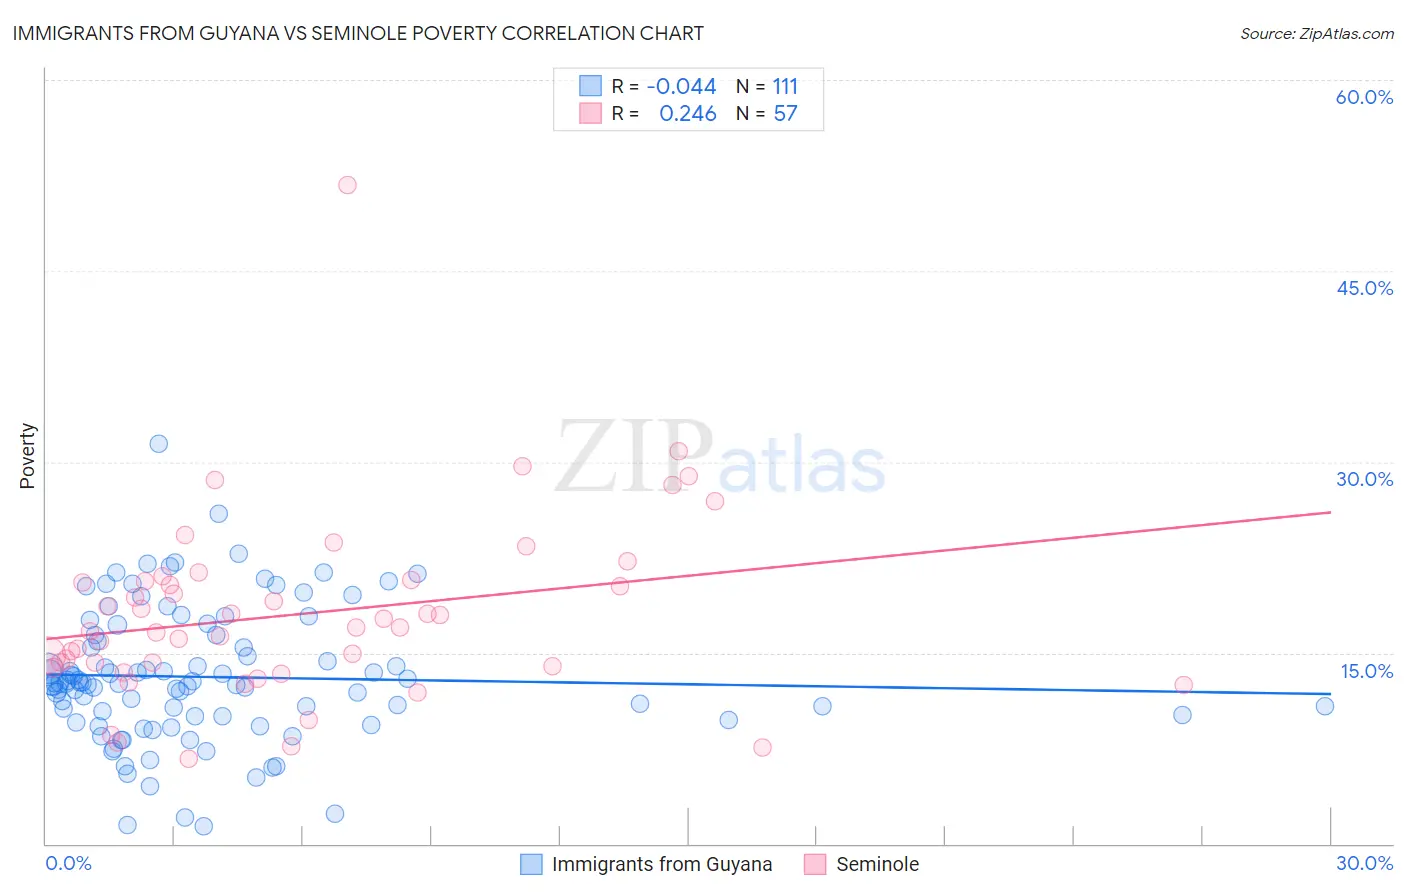
Immigrants from Guyana vs Seminole Poverty Correlation Chart
The statistical analysis conducted on geographies consisting of 183,648,527 people shows no correlation between the proportion of Immigrants from Guyana and poverty level in the United States with a correlation coefficient (R) of -0.044 and weighted average of 14.5%. Similarly, the statistical analysis conducted on geographies consisting of 118,300,623 people shows a weak positive correlation between the proportion of Seminole and poverty level in the United States with a correlation coefficient (R) of 0.246 and weighted average of 15.6%, a difference of 8.0%.
Poverty Correlation Summary
| Measurement | Immigrants from Guyana | Seminole |
| Minimum | 1.4% | 6.7% |
| Maximum | 31.4% | 51.8% |
| Range | 30.0% | 45.1% |
| Mean | 13.1% | 18.0% |
| Median | 12.6% | 16.9% |
| Interquartile 25% (IQ1) | 10.0% | 13.9% |
| Interquartile 75% (IQ3) | 16.4% | 20.7% |
| Interquartile Range (IQR) | 6.4% | 6.8% |
| Standard Deviation (Sample) | 5.3% | 7.3% |
| Standard Deviation (Population) | 5.2% | 7.2% |
Similar Demographics by Poverty
Demographics Similar to Immigrants from Guyana by Poverty
In terms of poverty, the demographic groups most similar to Immigrants from Guyana are Immigrants from Jamaica (14.4%, a difference of 0.13%), Guyanese (14.5%, a difference of 0.17%), Jamaican (14.4%, a difference of 0.21%), Iroquois (14.5%, a difference of 0.49%), and Subsaharan African (14.5%, a difference of 0.52%).
| Demographics | Rating | Rank | Poverty |
| Ottawa | 0.1 /100 | #258 | Tragic 14.3% |
| Immigrants | Nicaragua | 0.1 /100 | #259 | Tragic 14.3% |
| Cape Verdeans | 0.1 /100 | #260 | Tragic 14.4% |
| Cherokee | 0.1 /100 | #261 | Tragic 14.4% |
| Immigrants | Liberia | 0.1 /100 | #262 | Tragic 14.4% |
| Jamaicans | 0.1 /100 | #263 | Tragic 14.4% |
| Immigrants | Jamaica | 0.1 /100 | #264 | Tragic 14.4% |
| Immigrants | Guyana | 0.1 /100 | #265 | Tragic 14.5% |
| Guyanese | 0.1 /100 | #266 | Tragic 14.5% |
| Iroquois | 0.1 /100 | #267 | Tragic 14.5% |
| Sub-Saharan Africans | 0.1 /100 | #268 | Tragic 14.5% |
| Immigrants | Cuba | 0.1 /100 | #269 | Tragic 14.6% |
| Central Americans | 0.1 /100 | #270 | Tragic 14.6% |
| Shoshone | 0.0 /100 | #271 | Tragic 14.7% |
| Chickasaw | 0.0 /100 | #272 | Tragic 14.7% |
Demographics Similar to Seminole by Poverty
In terms of poverty, the demographic groups most similar to Seminole are Choctaw (15.6%, a difference of 0.040%), Dutch West Indian (15.6%, a difference of 0.090%), African (15.6%, a difference of 0.15%), Creek (15.6%, a difference of 0.23%), and Chippewa (15.7%, a difference of 0.48%).
| Demographics | Rating | Rank | Poverty |
| Somalis | 0.0 /100 | #302 | Tragic 15.4% |
| Immigrants | Caribbean | 0.0 /100 | #303 | Tragic 15.5% |
| Immigrants | Mexico | 0.0 /100 | #304 | Tragic 15.5% |
| Immigrants | Guatemala | 0.0 /100 | #305 | Tragic 15.5% |
| Creek | 0.0 /100 | #306 | Tragic 15.6% |
| Africans | 0.0 /100 | #307 | Tragic 15.6% |
| Choctaw | 0.0 /100 | #308 | Tragic 15.6% |
| Seminole | 0.0 /100 | #309 | Tragic 15.6% |
| Dutch West Indians | 0.0 /100 | #310 | Tragic 15.6% |
| Chippewa | 0.0 /100 | #311 | Tragic 15.7% |
| Cajuns | 0.0 /100 | #312 | Tragic 15.7% |
| Immigrants | Grenada | 0.0 /100 | #313 | Tragic 15.8% |
| Immigrants | Somalia | 0.0 /100 | #314 | Tragic 15.8% |
| British West Indians | 0.0 /100 | #315 | Tragic 15.9% |
| Hondurans | 0.0 /100 | #316 | Tragic 15.9% |