Lithuanian vs Immigrants from Austria Female Disability
COMPARE
Lithuanian
Immigrants from Austria
Female Disability
Female Disability Comparison
Lithuanians
Immigrants from Austria
12.2%
FEMALE DISABILITY
59.5/ 100
METRIC RATING
166th/ 347
METRIC RANK
12.0%
FEMALE DISABILITY
87.9/ 100
METRIC RATING
144th/ 347
METRIC RANK
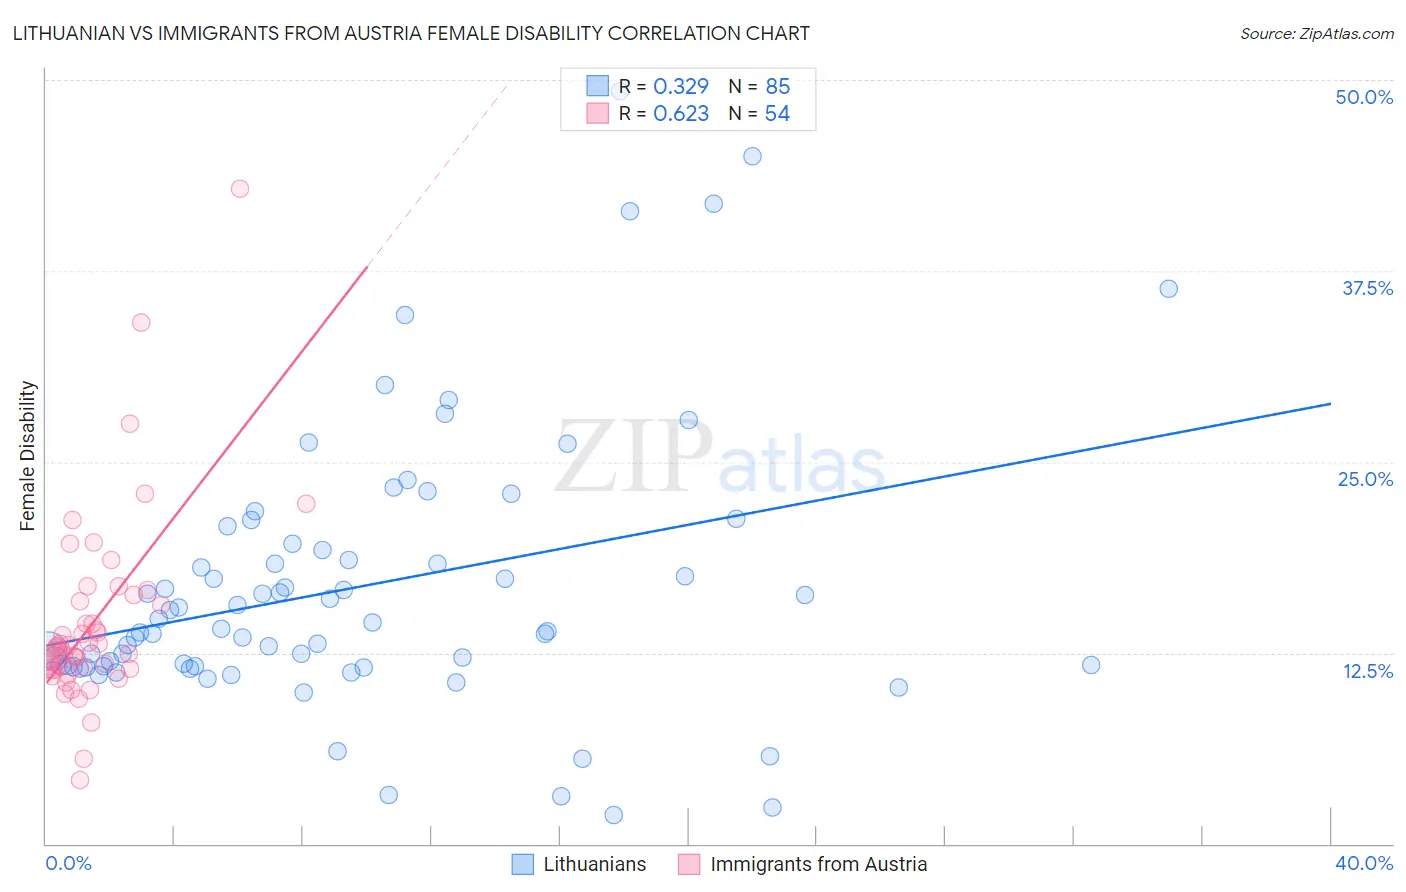
Lithuanian vs Immigrants from Austria Female Disability Correlation Chart
The statistical analysis conducted on geographies consisting of 421,926,295 people shows a mild positive correlation between the proportion of Lithuanians and percentage of females with a disability in the United States with a correlation coefficient (R) of 0.329 and weighted average of 12.2%. Similarly, the statistical analysis conducted on geographies consisting of 167,970,521 people shows a significant positive correlation between the proportion of Immigrants from Austria and percentage of females with a disability in the United States with a correlation coefficient (R) of 0.623 and weighted average of 12.0%, a difference of 1.5%.
Female Disability Correlation Summary
| Measurement | Lithuanian | Immigrants from Austria |
| Minimum | 1.9% | 4.2% |
| Maximum | 49.2% | 42.9% |
| Range | 47.3% | 38.7% |
| Mean | 16.8% | 14.5% |
| Median | 14.0% | 12.8% |
| Interquartile 25% (IQ1) | 11.6% | 11.5% |
| Interquartile 75% (IQ3) | 19.4% | 15.9% |
| Interquartile Range (IQR) | 7.8% | 4.4% |
| Standard Deviation (Sample) | 9.0% | 6.3% |
| Standard Deviation (Population) | 9.0% | 6.3% |
Similar Demographics by Female Disability
Demographics Similar to Lithuanians by Female Disability
In terms of female disability, the demographic groups most similar to Lithuanians are Immigrants from Latin America (12.2%, a difference of 0.020%), Immigrants from Haiti (12.2%, a difference of 0.030%), Lebanese (12.2%, a difference of 0.050%), Immigrants from Oceania (12.1%, a difference of 0.090%), and Maltese (12.2%, a difference of 0.10%).
| Demographics | Rating | Rank | Female Disability |
| Immigrants | Central America | 67.7 /100 | #159 | Good 12.1% |
| Immigrants | Guatemala | 66.0 /100 | #160 | Good 12.1% |
| Guyanese | 64.7 /100 | #161 | Good 12.1% |
| Immigrants | Ukraine | 64.3 /100 | #162 | Good 12.1% |
| Guatemalans | 63.8 /100 | #163 | Good 12.1% |
| Czechs | 63.6 /100 | #164 | Good 12.1% |
| Immigrants | Oceania | 61.8 /100 | #165 | Good 12.1% |
| Lithuanians | 59.5 /100 | #166 | Average 12.2% |
| Immigrants | Latin America | 59.0 /100 | #167 | Average 12.2% |
| Immigrants | Haiti | 58.8 /100 | #168 | Average 12.2% |
| Lebanese | 58.1 /100 | #169 | Average 12.2% |
| Maltese | 57.0 /100 | #170 | Average 12.2% |
| Immigrants | Southern Europe | 56.3 /100 | #171 | Average 12.2% |
| Haitians | 51.9 /100 | #172 | Average 12.2% |
| Immigrants | Mexico | 50.8 /100 | #173 | Average 12.2% |
Demographics Similar to Immigrants from Austria by Female Disability
In terms of female disability, the demographic groups most similar to Immigrants from Austria are Estonian (12.0%, a difference of 0.0%), Immigrants from Sudan (11.9%, a difference of 0.17%), Immigrants from Africa (11.9%, a difference of 0.21%), Pakistani (12.0%, a difference of 0.27%), and Nigerian (12.0%, a difference of 0.30%).
| Demographics | Rating | Rank | Female Disability |
| Immigrants | Norway | 93.8 /100 | #137 | Exceptional 11.9% |
| Ecuadorians | 93.4 /100 | #138 | Exceptional 11.9% |
| Immigrants | Hungary | 92.8 /100 | #139 | Exceptional 11.9% |
| Romanians | 91.6 /100 | #140 | Exceptional 11.9% |
| Immigrants | Ecuador | 91.5 /100 | #141 | Exceptional 11.9% |
| Immigrants | Africa | 90.0 /100 | #142 | Excellent 11.9% |
| Immigrants | Sudan | 89.6 /100 | #143 | Excellent 11.9% |
| Immigrants | Austria | 87.9 /100 | #144 | Excellent 12.0% |
| Estonians | 87.8 /100 | #145 | Excellent 12.0% |
| Pakistanis | 84.6 /100 | #146 | Excellent 12.0% |
| Nigerians | 84.0 /100 | #147 | Excellent 12.0% |
| Immigrants | Kenya | 83.1 /100 | #148 | Excellent 12.0% |
| Greeks | 82.0 /100 | #149 | Excellent 12.0% |
| Immigrants | Moldova | 81.4 /100 | #150 | Excellent 12.0% |
| Icelanders | 80.7 /100 | #151 | Excellent 12.0% |