Lithuanian vs Immigrants from Austria Householder Income Under 25 years
COMPARE
Lithuanian
Immigrants from Austria
Householder Income Under 25 years
Householder Income Under 25 years Comparison
Lithuanians
Immigrants from Austria
$53,552
HOUSEHOLDER INCOME UNDER 25 YEARS
96.6/ 100
METRIC RATING
117th/ 347
METRIC RANK
$52,400
HOUSEHOLDER INCOME UNDER 25 YEARS
62.6/ 100
METRIC RATING
166th/ 347
METRIC RANK
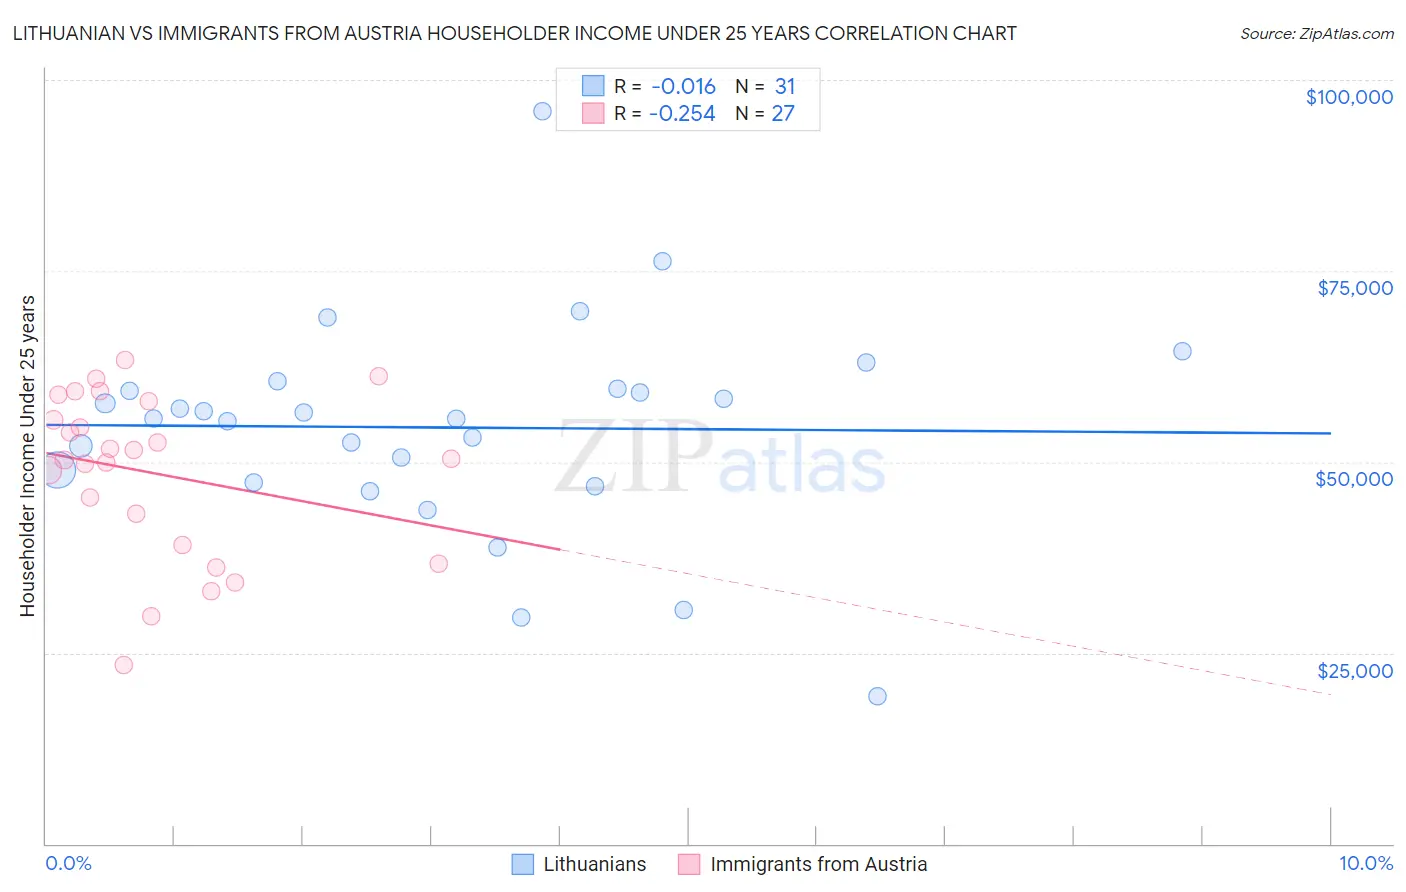
Lithuanian vs Immigrants from Austria Householder Income Under 25 years Correlation Chart
The statistical analysis conducted on geographies consisting of 345,043,836 people shows no correlation between the proportion of Lithuanians and household income with householder under the age of 25 in the United States with a correlation coefficient (R) of -0.016 and weighted average of $53,552. Similarly, the statistical analysis conducted on geographies consisting of 148,326,124 people shows a weak negative correlation between the proportion of Immigrants from Austria and household income with householder under the age of 25 in the United States with a correlation coefficient (R) of -0.254 and weighted average of $52,400, a difference of 2.2%.
Householder Income Under 25 years Correlation Summary
| Measurement | Lithuanian | Immigrants from Austria |
| Minimum | $19,375 | $23,462 |
| Maximum | $95,845 | $63,282 |
| Range | $76,470 | $39,820 |
| Mean | $54,494 | $48,547 |
| Median | $55,664 | $50,350 |
| Interquartile 25% (IQ1) | $47,340 | $39,087 |
| Interquartile 75% (IQ3) | $59,595 | $57,875 |
| Interquartile Range (IQR) | $12,255 | $18,788 |
| Standard Deviation (Sample) | $14,114 | $10,655 |
| Standard Deviation (Population) | $13,885 | $10,456 |
Similar Demographics by Householder Income Under 25 years
Demographics Similar to Lithuanians by Householder Income Under 25 years
In terms of householder income under 25 years, the demographic groups most similar to Lithuanians are Immigrants from Spain ($53,560, a difference of 0.010%), Immigrants from Switzerland ($53,528, a difference of 0.050%), Immigrants from Albania ($53,597, a difference of 0.080%), Immigrants from Sweden ($53,621, a difference of 0.13%), and Romanian ($53,632, a difference of 0.15%).
| Demographics | Rating | Rank | Householder Income Under 25 years |
| Greeks | 97.7 /100 | #110 | Exceptional $53,715 |
| Immigrants | Colombia | 97.7 /100 | #111 | Exceptional $53,714 |
| Immigrants | Oceania | 97.5 /100 | #112 | Exceptional $53,680 |
| Romanians | 97.2 /100 | #113 | Exceptional $53,632 |
| Immigrants | Sweden | 97.1 /100 | #114 | Exceptional $53,621 |
| Immigrants | Albania | 96.9 /100 | #115 | Exceptional $53,597 |
| Immigrants | Spain | 96.6 /100 | #116 | Exceptional $53,560 |
| Lithuanians | 96.6 /100 | #117 | Exceptional $53,552 |
| Immigrants | Switzerland | 96.3 /100 | #118 | Exceptional $53,528 |
| Italians | 95.4 /100 | #119 | Exceptional $53,426 |
| Guamanians/Chamorros | 95.3 /100 | #120 | Exceptional $53,423 |
| Immigrants | Canada | 95.2 /100 | #121 | Exceptional $53,411 |
| Immigrants | Ethiopia | 95.2 /100 | #122 | Exceptional $53,408 |
| Immigrants | Iraq | 94.9 /100 | #123 | Exceptional $53,384 |
| Colombians | 94.6 /100 | #124 | Exceptional $53,357 |
Demographics Similar to Immigrants from Austria by Householder Income Under 25 years
In terms of householder income under 25 years, the demographic groups most similar to Immigrants from Austria are Polish ($52,407, a difference of 0.010%), Immigrants from Uganda ($52,374, a difference of 0.050%), Immigrants from Trinidad and Tobago ($52,437, a difference of 0.070%), Japanese ($52,365, a difference of 0.070%), and Immigrants from Chile ($52,440, a difference of 0.080%).
| Demographics | Rating | Rank | Householder Income Under 25 years |
| Mongolians | 70.2 /100 | #159 | Good $52,540 |
| Immigrants | Turkey | 68.3 /100 | #160 | Good $52,503 |
| Uruguayans | 66.2 /100 | #161 | Good $52,465 |
| Immigrants | Cambodia | 65.4 /100 | #162 | Good $52,450 |
| Immigrants | Chile | 64.8 /100 | #163 | Good $52,440 |
| Immigrants | Trinidad and Tobago | 64.7 /100 | #164 | Good $52,437 |
| Poles | 63.0 /100 | #165 | Good $52,407 |
| Immigrants | Austria | 62.6 /100 | #166 | Good $52,400 |
| Immigrants | Uganda | 61.1 /100 | #167 | Good $52,374 |
| Japanese | 60.5 /100 | #168 | Good $52,365 |
| Canadians | 58.8 /100 | #169 | Average $52,336 |
| Israelis | 58.8 /100 | #170 | Average $52,335 |
| Immigrants | Uruguay | 56.8 /100 | #171 | Average $52,302 |
| Cypriots | 51.2 /100 | #172 | Average $52,209 |
| Barbadians | 50.8 /100 | #173 | Average $52,202 |