Lithuanian vs Immigrants from Austria Median Female Earnings
COMPARE
Lithuanian
Immigrants from Austria
Median Female Earnings
Median Female Earnings Comparison
Lithuanians
Immigrants from Austria
$42,108
MEDIAN FEMALE EARNINGS
99.3/ 100
METRIC RATING
87th/ 347
METRIC RANK
$42,824
MEDIAN FEMALE EARNINGS
99.8/ 100
METRIC RATING
68th/ 347
METRIC RANK
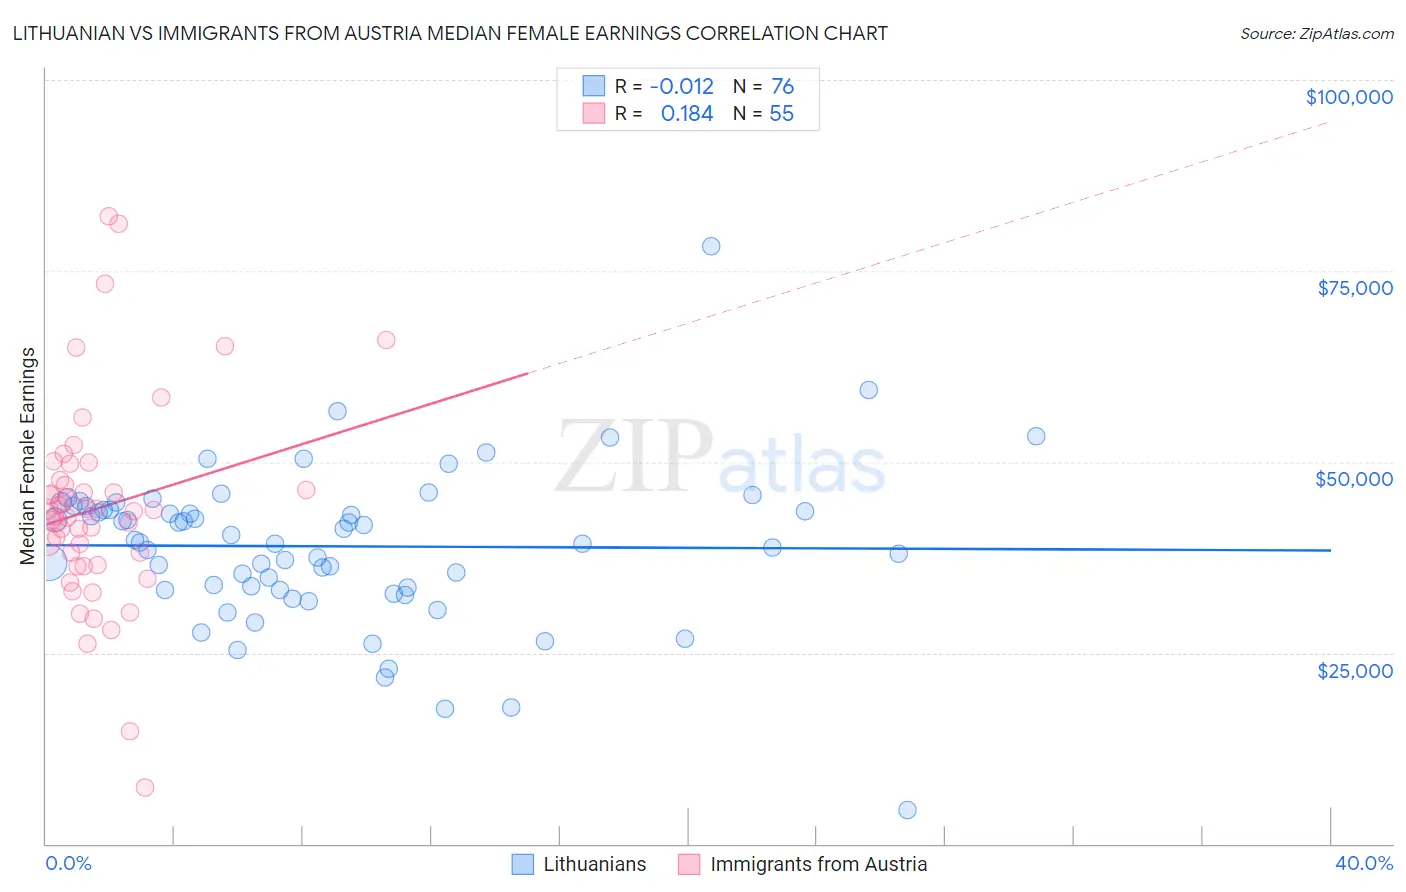
Lithuanian vs Immigrants from Austria Median Female Earnings Correlation Chart
The statistical analysis conducted on geographies consisting of 421,690,318 people shows no correlation between the proportion of Lithuanians and median female earnings in the United States with a correlation coefficient (R) of -0.012 and weighted average of $42,108. Similarly, the statistical analysis conducted on geographies consisting of 167,926,482 people shows a poor positive correlation between the proportion of Immigrants from Austria and median female earnings in the United States with a correlation coefficient (R) of 0.184 and weighted average of $42,824, a difference of 1.7%.
Median Female Earnings Correlation Summary
| Measurement | Lithuanian | Immigrants from Austria |
| Minimum | $4,435 | $7,363 |
| Maximum | $78,167 | $82,240 |
| Range | $73,732 | $74,877 |
| Mean | $38,946 | $43,980 |
| Median | $39,620 | $43,611 |
| Interquartile 25% (IQ1) | $33,413 | $36,503 |
| Interquartile 75% (IQ3) | $43,909 | $47,678 |
| Interquartile Range (IQR) | $10,496 | $11,175 |
| Standard Deviation (Sample) | $10,262 | $13,481 |
| Standard Deviation (Population) | $10,194 | $13,358 |
Demographics Similar to Lithuanians and Immigrants from Austria by Median Female Earnings
In terms of median female earnings, the demographic groups most similar to Lithuanians are Immigrants from St. Vincent and the Grenadines ($42,108, a difference of 0.0%), Laotian ($42,133, a difference of 0.060%), Immigrants from Sierra Leone ($42,214, a difference of 0.25%), Armenian ($42,212, a difference of 0.25%), and Immigrants from Morocco ($42,229, a difference of 0.29%). Similarly, the demographic groups most similar to Immigrants from Austria are Immigrants from Spain ($42,815, a difference of 0.020%), Immigrants from Egypt ($42,837, a difference of 0.030%), Immigrants from Ethiopia ($42,744, a difference of 0.19%), Immigrants from Romania ($42,718, a difference of 0.25%), and Albanian ($42,584, a difference of 0.56%).
| Demographics | Rating | Rank | Median Female Earnings |
| Immigrants | Egypt | 99.9 /100 | #67 | Exceptional $42,837 |
| Immigrants | Austria | 99.8 /100 | #68 | Exceptional $42,824 |
| Immigrants | Spain | 99.8 /100 | #69 | Exceptional $42,815 |
| Immigrants | Ethiopia | 99.8 /100 | #70 | Exceptional $42,744 |
| Immigrants | Romania | 99.8 /100 | #71 | Exceptional $42,718 |
| Albanians | 99.8 /100 | #72 | Exceptional $42,584 |
| Mongolians | 99.7 /100 | #73 | Exceptional $42,542 |
| Immigrants | South Africa | 99.7 /100 | #74 | Exceptional $42,508 |
| New Zealanders | 99.7 /100 | #75 | Exceptional $42,446 |
| Immigrants | Italy | 99.7 /100 | #76 | Exceptional $42,446 |
| Immigrants | Albania | 99.6 /100 | #77 | Exceptional $42,388 |
| Immigrants | Kazakhstan | 99.6 /100 | #78 | Exceptional $42,386 |
| Greeks | 99.6 /100 | #79 | Exceptional $42,336 |
| Immigrants | Moldova | 99.6 /100 | #80 | Exceptional $42,304 |
| Immigrants | Southern Europe | 99.5 /100 | #81 | Exceptional $42,275 |
| Immigrants | Morocco | 99.5 /100 | #82 | Exceptional $42,229 |
| Immigrants | Sierra Leone | 99.5 /100 | #83 | Exceptional $42,214 |
| Armenians | 99.5 /100 | #84 | Exceptional $42,212 |
| Laotians | 99.4 /100 | #85 | Exceptional $42,133 |
| Immigrants | St. Vincent and the Grenadines | 99.3 /100 | #86 | Exceptional $42,108 |
| Lithuanians | 99.3 /100 | #87 | Exceptional $42,108 |