Immigrants from Zimbabwe vs Immigrants from Austria Single Female Poverty
COMPARE
Immigrants from Zimbabwe
Immigrants from Austria
Single Female Poverty
Single Female Poverty Comparison
Immigrants from Zimbabwe
Immigrants from Austria
20.0%
SINGLE FEMALE POVERTY
95.9/ 100
METRIC RATING
113th/ 347
METRIC RANK
19.6%
SINGLE FEMALE POVERTY
98.8/ 100
METRIC RATING
93rd/ 347
METRIC RANK
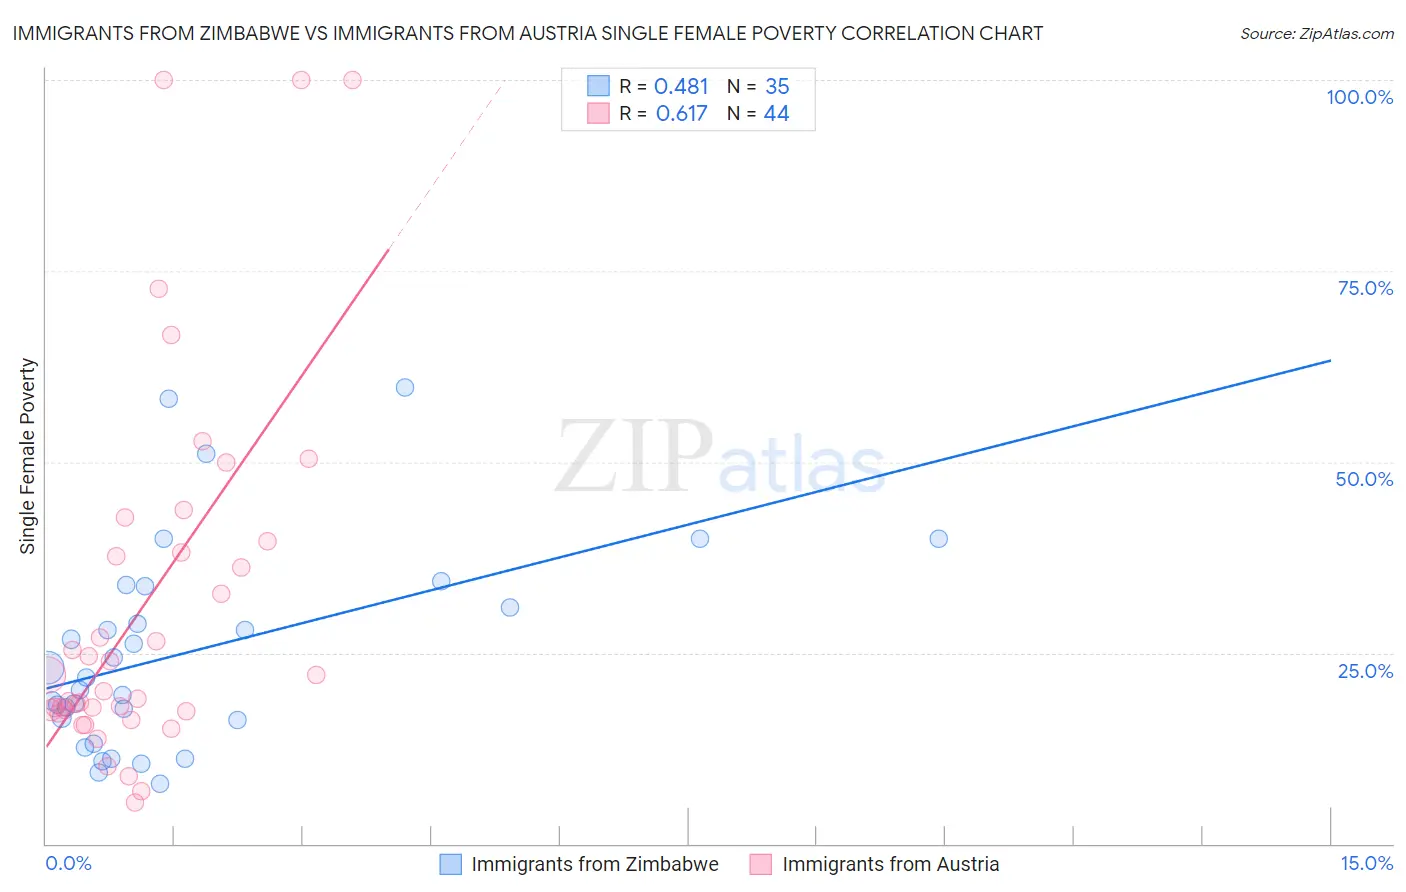
Immigrants from Zimbabwe vs Immigrants from Austria Single Female Poverty Correlation Chart
The statistical analysis conducted on geographies consisting of 117,320,666 people shows a moderate positive correlation between the proportion of Immigrants from Zimbabwe and poverty level among single females in the United States with a correlation coefficient (R) of 0.481 and weighted average of 20.0%. Similarly, the statistical analysis conducted on geographies consisting of 166,235,913 people shows a significant positive correlation between the proportion of Immigrants from Austria and poverty level among single females in the United States with a correlation coefficient (R) of 0.617 and weighted average of 19.6%, a difference of 2.1%.
Single Female Poverty Correlation Summary
| Measurement | Immigrants from Zimbabwe | Immigrants from Austria |
| Minimum | 7.9% | 5.5% |
| Maximum | 59.7% | 100.0% |
| Range | 51.9% | 94.5% |
| Mean | 25.1% | 31.3% |
| Median | 21.7% | 21.0% |
| Interquartile 25% (IQ1) | 16.2% | 17.4% |
| Interquartile 75% (IQ3) | 33.7% | 38.9% |
| Interquartile Range (IQR) | 17.6% | 21.4% |
| Standard Deviation (Sample) | 13.4% | 24.1% |
| Standard Deviation (Population) | 13.2% | 23.8% |
Demographics Similar to Immigrants from Zimbabwe and Immigrants from Austria by Single Female Poverty
In terms of single female poverty, the demographic groups most similar to Immigrants from Zimbabwe are Immigrants from Netherlands (20.0%, a difference of 0.050%), Carpatho Rusyn (20.0%, a difference of 0.12%), Immigrants from Western Asia (19.9%, a difference of 0.30%), Native Hawaiian (19.9%, a difference of 0.31%), and Colombian (19.9%, a difference of 0.31%). Similarly, the demographic groups most similar to Immigrants from Austria are Romanian (19.6%, a difference of 0.22%), Estonian (19.7%, a difference of 0.60%), Immigrants from Brazil (19.7%, a difference of 0.65%), Croatian (19.7%, a difference of 0.74%), and Immigrants from France (19.7%, a difference of 0.86%).
| Demographics | Rating | Rank | Single Female Poverty |
| Immigrants | Austria | 98.8 /100 | #93 | Exceptional 19.6% |
| Romanians | 98.6 /100 | #94 | Exceptional 19.6% |
| Estonians | 98.2 /100 | #95 | Exceptional 19.7% |
| Immigrants | Brazil | 98.2 /100 | #96 | Exceptional 19.7% |
| Croatians | 98.1 /100 | #97 | Exceptional 19.7% |
| Immigrants | France | 97.9 /100 | #98 | Exceptional 19.7% |
| Sierra Leoneans | 97.9 /100 | #99 | Exceptional 19.7% |
| Ukrainians | 97.6 /100 | #100 | Exceptional 19.8% |
| Immigrants | Belgium | 97.3 /100 | #101 | Exceptional 19.8% |
| Immigrants | Cameroon | 97.3 /100 | #102 | Exceptional 19.8% |
| Immigrants | Southern Europe | 97.1 /100 | #103 | Exceptional 19.9% |
| Chileans | 96.9 /100 | #104 | Exceptional 19.9% |
| Israelis | 96.9 /100 | #105 | Exceptional 19.9% |
| Ethiopians | 96.7 /100 | #106 | Exceptional 19.9% |
| Immigrants | Syria | 96.7 /100 | #107 | Exceptional 19.9% |
| Native Hawaiians | 96.6 /100 | #108 | Exceptional 19.9% |
| Colombians | 96.6 /100 | #109 | Exceptional 19.9% |
| Immigrants | Western Asia | 96.5 /100 | #110 | Exceptional 19.9% |
| Carpatho Rusyns | 96.1 /100 | #111 | Exceptional 20.0% |
| Immigrants | Netherlands | 96.0 /100 | #112 | Exceptional 20.0% |
| Immigrants | Zimbabwe | 95.9 /100 | #113 | Exceptional 20.0% |