Lithuanian vs Danish Female Poverty
COMPARE
Lithuanian
Danish
Female Poverty
Female Poverty Comparison
Lithuanians
Danes
11.4%
FEMALE POVERTY
99.8/ 100
METRIC RATING
14th/ 347
METRIC RANK
11.7%
FEMALE POVERTY
99.5/ 100
METRIC RATING
32nd/ 347
METRIC RANK
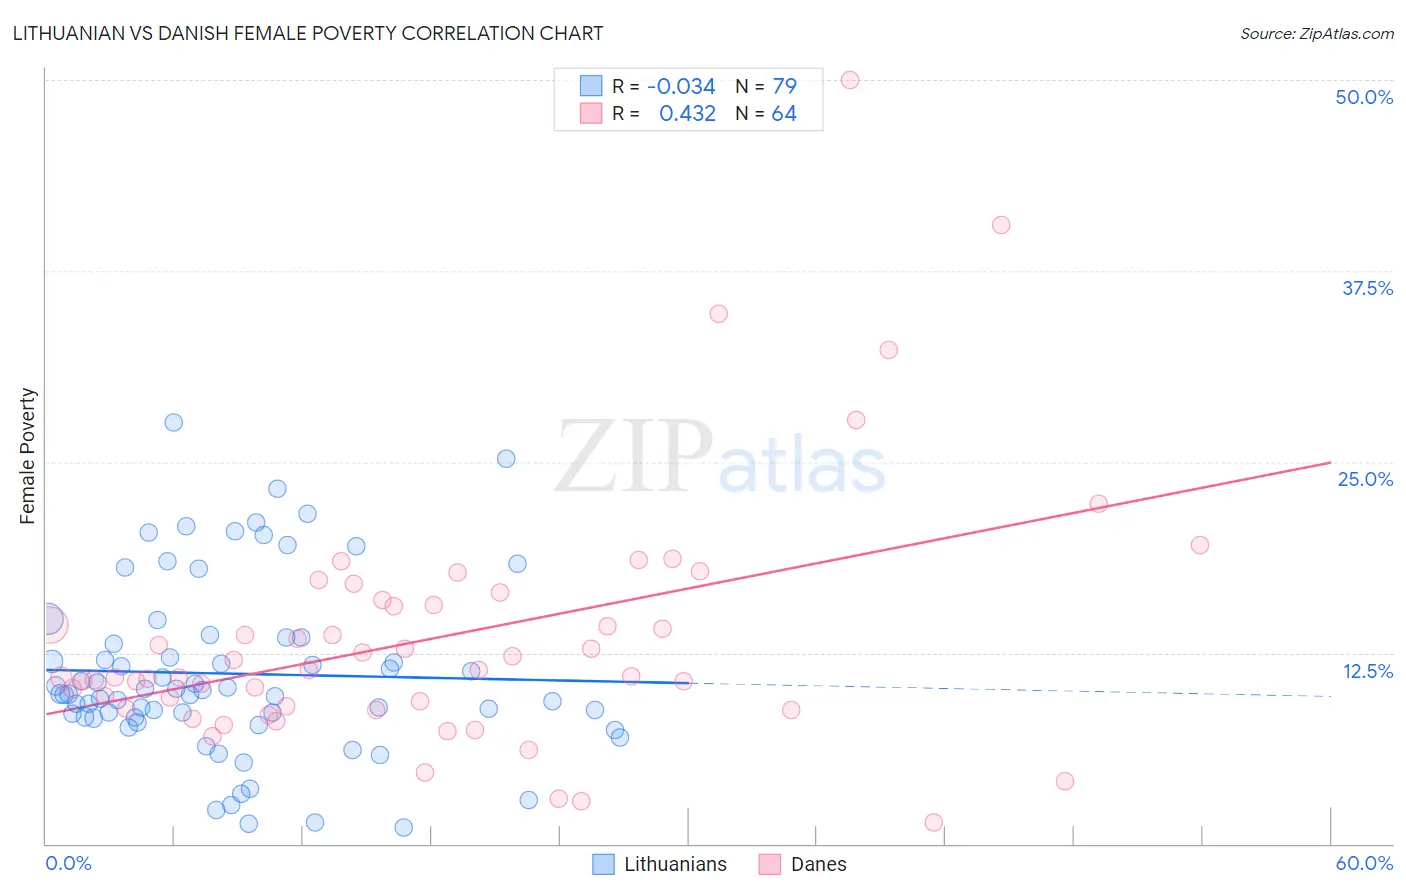
Lithuanian vs Danish Female Poverty Correlation Chart
The statistical analysis conducted on geographies consisting of 421,598,229 people shows no correlation between the proportion of Lithuanians and poverty level among females in the United States with a correlation coefficient (R) of -0.034 and weighted average of 11.4%. Similarly, the statistical analysis conducted on geographies consisting of 473,673,857 people shows a moderate positive correlation between the proportion of Danes and poverty level among females in the United States with a correlation coefficient (R) of 0.432 and weighted average of 11.7%, a difference of 3.1%.
Female Poverty Correlation Summary
| Measurement | Lithuanian | Danish |
| Minimum | 1.0% | 1.4% |
| Maximum | 27.5% | 50.0% |
| Range | 26.5% | 48.6% |
| Mean | 11.1% | 13.5% |
| Median | 9.8% | 11.2% |
| Interquartile 25% (IQ1) | 8.2% | 8.9% |
| Interquartile 75% (IQ3) | 13.5% | 15.8% |
| Interquartile Range (IQR) | 5.2% | 6.9% |
| Standard Deviation (Sample) | 5.7% | 8.4% |
| Standard Deviation (Population) | 5.6% | 8.3% |
Demographics Similar to Lithuanians and Danes by Female Poverty
In terms of female poverty, the demographic groups most similar to Lithuanians are Latvian (11.4%, a difference of 0.32%), Immigrants from Bolivia (11.5%, a difference of 0.80%), Bolivian (11.5%, a difference of 0.87%), Immigrants from Scotland (11.5%, a difference of 0.92%), and Immigrants from Lithuania (11.3%, a difference of 0.96%). Similarly, the demographic groups most similar to Danes are Cypriot (11.8%, a difference of 0.070%), Polish (11.7%, a difference of 0.13%), Greek (11.7%, a difference of 0.35%), Immigrants from North Macedonia (11.7%, a difference of 0.43%), and Immigrants from Korea (11.7%, a difference of 0.58%).
| Demographics | Rating | Rank | Female Poverty |
| Immigrants | Lithuania | 99.9 /100 | #13 | Exceptional 11.3% |
| Lithuanians | 99.8 /100 | #14 | Exceptional 11.4% |
| Latvians | 99.8 /100 | #15 | Exceptional 11.4% |
| Immigrants | Bolivia | 99.8 /100 | #16 | Exceptional 11.5% |
| Bolivians | 99.8 /100 | #17 | Exceptional 11.5% |
| Immigrants | Scotland | 99.8 /100 | #18 | Exceptional 11.5% |
| Norwegians | 99.8 /100 | #19 | Exceptional 11.5% |
| Eastern Europeans | 99.7 /100 | #20 | Exceptional 11.5% |
| Italians | 99.7 /100 | #21 | Exceptional 11.6% |
| Swedes | 99.7 /100 | #22 | Exceptional 11.6% |
| Burmese | 99.7 /100 | #23 | Exceptional 11.6% |
| Luxembourgers | 99.7 /100 | #24 | Exceptional 11.6% |
| Immigrants | Northern Europe | 99.6 /100 | #25 | Exceptional 11.6% |
| Croatians | 99.6 /100 | #26 | Exceptional 11.6% |
| Iranians | 99.6 /100 | #27 | Exceptional 11.7% |
| Immigrants | Korea | 99.6 /100 | #28 | Exceptional 11.7% |
| Immigrants | North Macedonia | 99.6 /100 | #29 | Exceptional 11.7% |
| Greeks | 99.5 /100 | #30 | Exceptional 11.7% |
| Poles | 99.5 /100 | #31 | Exceptional 11.7% |
| Danes | 99.5 /100 | #32 | Exceptional 11.7% |
| Cypriots | 99.5 /100 | #33 | Exceptional 11.8% |