Aleut vs Cree Family Poverty
COMPARE
Aleut
Cree
Family Poverty
Family Poverty Comparison
Aleuts
Cree
9.5%
FAMILY POVERTY
18.0/ 100
METRIC RATING
205th/ 347
METRIC RANK
10.5%
FAMILY POVERTY
0.7/ 100
METRIC RATING
244th/ 347
METRIC RANK
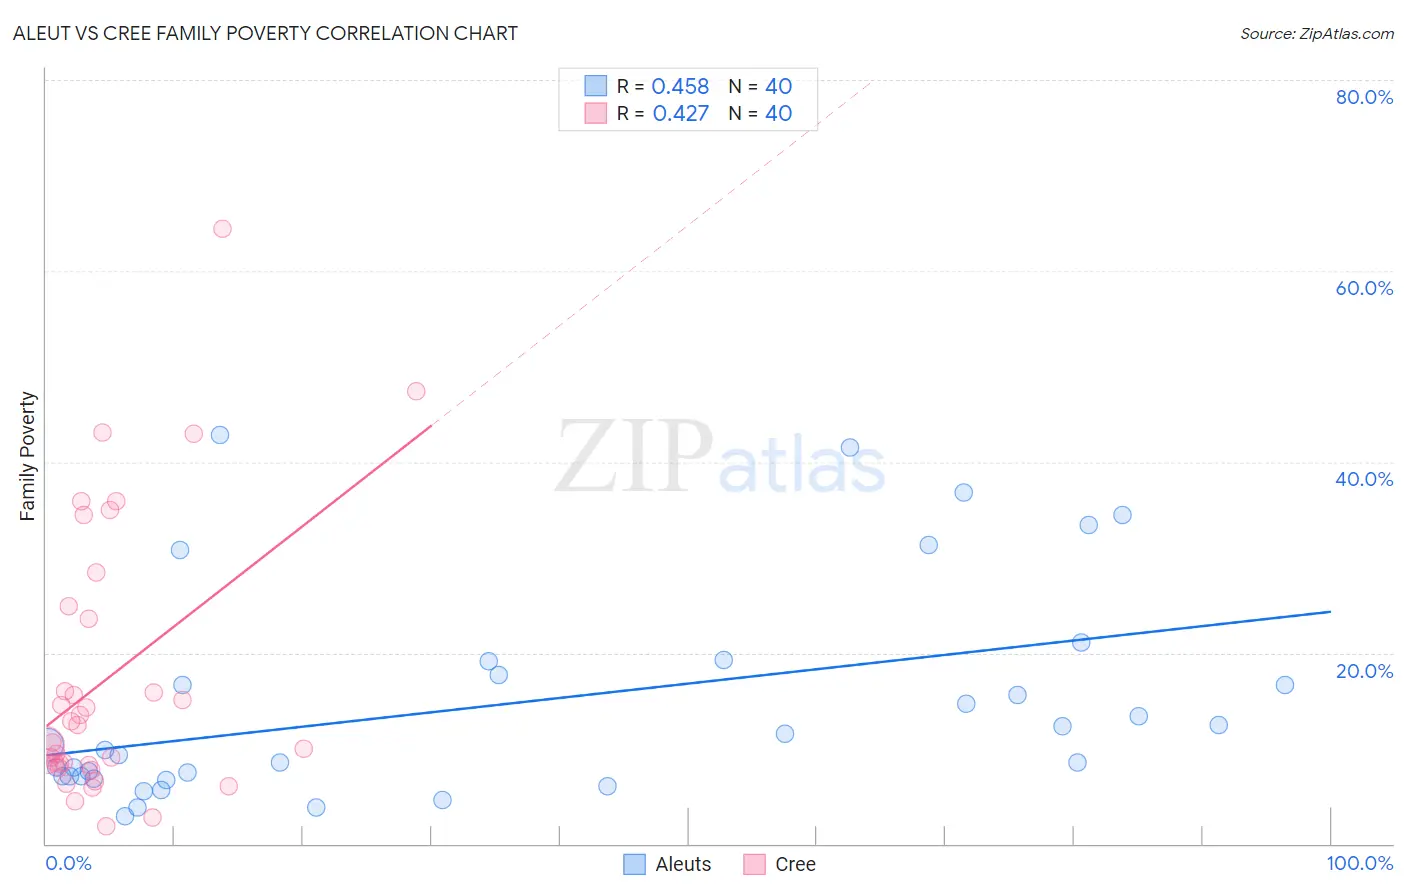
Aleut vs Cree Family Poverty Correlation Chart
The statistical analysis conducted on geographies consisting of 61,739,595 people shows a moderate positive correlation between the proportion of Aleuts and poverty level among families in the United States with a correlation coefficient (R) of 0.458 and weighted average of 9.5%. Similarly, the statistical analysis conducted on geographies consisting of 76,172,191 people shows a moderate positive correlation between the proportion of Cree and poverty level among families in the United States with a correlation coefficient (R) of 0.427 and weighted average of 10.5%, a difference of 10.7%.
Family Poverty Correlation Summary
| Measurement | Aleut | Cree |
| Minimum | 2.9% | 1.8% |
| Maximum | 42.9% | 64.4% |
| Range | 40.0% | 62.6% |
| Mean | 14.6% | 17.4% |
| Median | 10.1% | 11.6% |
| Interquartile 25% (IQ1) | 7.1% | 8.3% |
| Interquartile 75% (IQ3) | 18.4% | 24.2% |
| Interquartile Range (IQR) | 11.3% | 16.0% |
| Standard Deviation (Sample) | 11.0% | 14.4% |
| Standard Deviation (Population) | 10.9% | 14.2% |
Similar Demographics by Family Poverty
Demographics Similar to Aleuts by Family Poverty
In terms of family poverty, the demographic groups most similar to Aleuts are Immigrants from South America (9.5%, a difference of 0.010%), Immigrants from Lebanon (9.4%, a difference of 0.19%), German Russian (9.4%, a difference of 0.29%), Immigrants from Sierra Leone (9.4%, a difference of 0.33%), and Immigrants from Portugal (9.4%, a difference of 0.51%).
| Demographics | Rating | Rank | Family Poverty |
| Iraqis | 24.2 /100 | #198 | Fair 9.3% |
| Spaniards | 22.8 /100 | #199 | Fair 9.4% |
| Immigrants | Costa Rica | 21.7 /100 | #200 | Fair 9.4% |
| Immigrants | Portugal | 20.5 /100 | #201 | Fair 9.4% |
| Immigrants | Sierra Leone | 19.6 /100 | #202 | Poor 9.4% |
| German Russians | 19.4 /100 | #203 | Poor 9.4% |
| Immigrants | Lebanon | 18.9 /100 | #204 | Poor 9.4% |
| Aleuts | 18.0 /100 | #205 | Poor 9.5% |
| Immigrants | South America | 18.0 /100 | #206 | Poor 9.5% |
| Sierra Leoneans | 15.6 /100 | #207 | Poor 9.5% |
| Immigrants | Eastern Africa | 15.1 /100 | #208 | Poor 9.5% |
| Immigrants | Uruguay | 14.0 /100 | #209 | Poor 9.5% |
| Alsatians | 11.3 /100 | #210 | Poor 9.6% |
| Malaysians | 10.6 /100 | #211 | Poor 9.6% |
| Immigrants | Thailand | 9.7 /100 | #212 | Tragic 9.7% |
Demographics Similar to Cree by Family Poverty
In terms of family poverty, the demographic groups most similar to Cree are Nepalese (10.4%, a difference of 0.46%), Immigrants from Burma/Myanmar (10.5%, a difference of 0.61%), Alaska Native (10.4%, a difference of 0.94%), Cherokee (10.6%, a difference of 1.3%), and Liberian (10.6%, a difference of 1.3%).
| Demographics | Rating | Rank | Family Poverty |
| Immigrants | Laos | 1.7 /100 | #237 | Tragic 10.2% |
| French American Indians | 1.5 /100 | #238 | Tragic 10.2% |
| Potawatomi | 1.5 /100 | #239 | Tragic 10.2% |
| Immigrants | Azores | 1.4 /100 | #240 | Tragic 10.3% |
| Ghanaians | 1.3 /100 | #241 | Tragic 10.3% |
| Alaska Natives | 1.0 /100 | #242 | Tragic 10.4% |
| Nepalese | 0.8 /100 | #243 | Tragic 10.4% |
| Cree | 0.7 /100 | #244 | Tragic 10.5% |
| Immigrants | Burma/Myanmar | 0.6 /100 | #245 | Tragic 10.5% |
| Cherokee | 0.5 /100 | #246 | Tragic 10.6% |
| Liberians | 0.4 /100 | #247 | Tragic 10.6% |
| Nicaraguans | 0.4 /100 | #248 | Tragic 10.6% |
| Cubans | 0.4 /100 | #249 | Tragic 10.6% |
| Salvadorans | 0.3 /100 | #250 | Tragic 10.7% |
| Iroquois | 0.3 /100 | #251 | Tragic 10.7% |