Lithuanian vs Ethiopian Family Poverty
COMPARE
Lithuanian
Ethiopian
Family Poverty
Family Poverty Comparison
Lithuanians
Ethiopians
7.2%
FAMILY POVERTY
99.8/ 100
METRIC RATING
15th/ 347
METRIC RANK
8.8%
FAMILY POVERTY
66.3/ 100
METRIC RATING
162nd/ 347
METRIC RANK
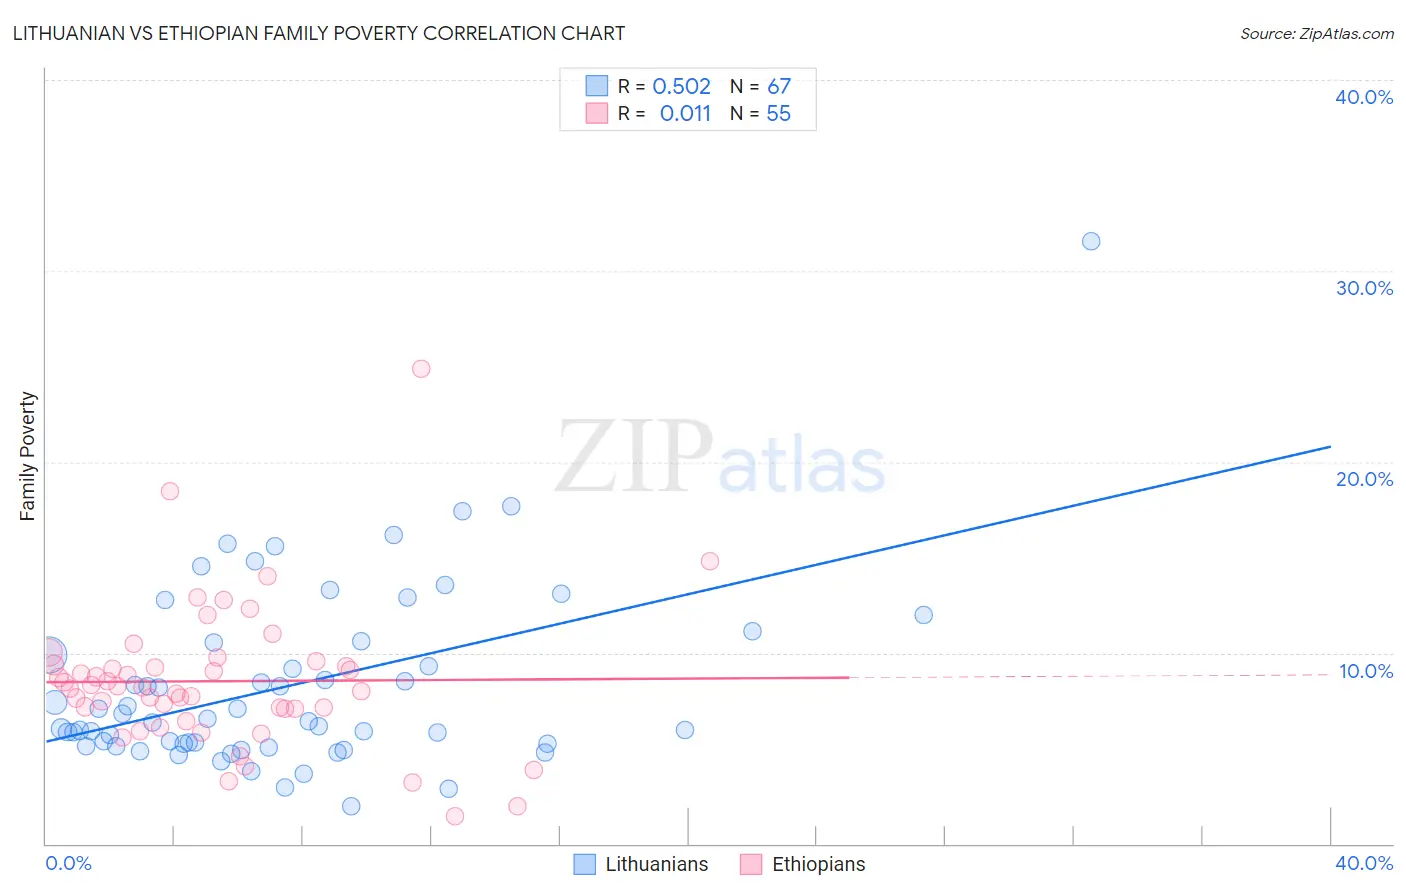
Lithuanian vs Ethiopian Family Poverty Correlation Chart
The statistical analysis conducted on geographies consisting of 420,202,329 people shows a substantial positive correlation between the proportion of Lithuanians and poverty level among families in the United States with a correlation coefficient (R) of 0.502 and weighted average of 7.2%. Similarly, the statistical analysis conducted on geographies consisting of 222,923,037 people shows no correlation between the proportion of Ethiopians and poverty level among families in the United States with a correlation coefficient (R) of 0.011 and weighted average of 8.8%, a difference of 22.6%.
Family Poverty Correlation Summary
| Measurement | Lithuanian | Ethiopian |
| Minimum | 2.0% | 1.4% |
| Maximum | 31.6% | 24.9% |
| Range | 29.6% | 23.5% |
| Mean | 8.3% | 8.5% |
| Median | 6.4% | 8.2% |
| Interquartile 25% (IQ1) | 5.2% | 7.1% |
| Interquartile 75% (IQ3) | 10.5% | 9.4% |
| Interquartile Range (IQR) | 5.3% | 2.3% |
| Standard Deviation (Sample) | 4.8% | 3.8% |
| Standard Deviation (Population) | 4.8% | 3.8% |
Similar Demographics by Family Poverty
Demographics Similar to Lithuanians by Family Poverty
In terms of family poverty, the demographic groups most similar to Lithuanians are Immigrants from South Central Asia (7.2%, a difference of 0.27%), Luxembourger (7.2%, a difference of 0.50%), Immigrants from Lithuania (7.2%, a difference of 0.51%), Eastern European (7.2%, a difference of 0.81%), and Swedish (7.1%, a difference of 0.88%).
| Demographics | Rating | Rank | Family Poverty |
| Bhutanese | 99.9 /100 | #8 | Exceptional 7.0% |
| Latvians | 99.9 /100 | #9 | Exceptional 7.1% |
| Bulgarians | 99.8 /100 | #10 | Exceptional 7.1% |
| Immigrants | Singapore | 99.8 /100 | #11 | Exceptional 7.1% |
| Maltese | 99.8 /100 | #12 | Exceptional 7.1% |
| Swedes | 99.8 /100 | #13 | Exceptional 7.1% |
| Iranians | 99.8 /100 | #14 | Exceptional 7.1% |
| Lithuanians | 99.8 /100 | #15 | Exceptional 7.2% |
| Immigrants | South Central Asia | 99.8 /100 | #16 | Exceptional 7.2% |
| Luxembourgers | 99.8 /100 | #17 | Exceptional 7.2% |
| Immigrants | Lithuania | 99.8 /100 | #18 | Exceptional 7.2% |
| Eastern Europeans | 99.7 /100 | #19 | Exceptional 7.2% |
| Immigrants | Hong Kong | 99.7 /100 | #20 | Exceptional 7.3% |
| Immigrants | Iran | 99.7 /100 | #21 | Exceptional 7.3% |
| Danes | 99.7 /100 | #22 | Exceptional 7.3% |
Demographics Similar to Ethiopians by Family Poverty
In terms of family poverty, the demographic groups most similar to Ethiopians are Pennsylvania German (8.8%, a difference of 0.050%), Immigrants from Northern Africa (8.8%, a difference of 0.090%), Hungarian (8.8%, a difference of 0.13%), Celtic (8.8%, a difference of 0.21%), and Guamanian/Chamorro (8.8%, a difference of 0.24%).
| Demographics | Rating | Rank | Family Poverty |
| Immigrants | Kuwait | 73.6 /100 | #155 | Good 8.7% |
| Immigrants | Oceania | 71.2 /100 | #156 | Good 8.7% |
| Tsimshian | 69.3 /100 | #157 | Good 8.8% |
| Whites/Caucasians | 69.1 /100 | #158 | Good 8.8% |
| Peruvians | 68.0 /100 | #159 | Good 8.8% |
| Hungarians | 67.2 /100 | #160 | Good 8.8% |
| Immigrants | Northern Africa | 66.9 /100 | #161 | Good 8.8% |
| Ethiopians | 66.3 /100 | #162 | Good 8.8% |
| Pennsylvania Germans | 66.0 /100 | #163 | Good 8.8% |
| Celtics | 64.9 /100 | #164 | Good 8.8% |
| Guamanians/Chamorros | 64.7 /100 | #165 | Good 8.8% |
| Afghans | 63.5 /100 | #166 | Good 8.8% |
| Immigrants | Ethiopia | 62.5 /100 | #167 | Good 8.9% |
| Israelis | 62.1 /100 | #168 | Good 8.9% |
| Immigrants | Chile | 59.6 /100 | #169 | Average 8.9% |