Jamaican vs Cree Family Poverty
COMPARE
Jamaican
Cree
Family Poverty
Family Poverty Comparison
Jamaicans
Cree
11.1%
FAMILY POVERTY
0.1/ 100
METRIC RATING
268th/ 347
METRIC RANK
10.5%
FAMILY POVERTY
0.7/ 100
METRIC RATING
244th/ 347
METRIC RANK
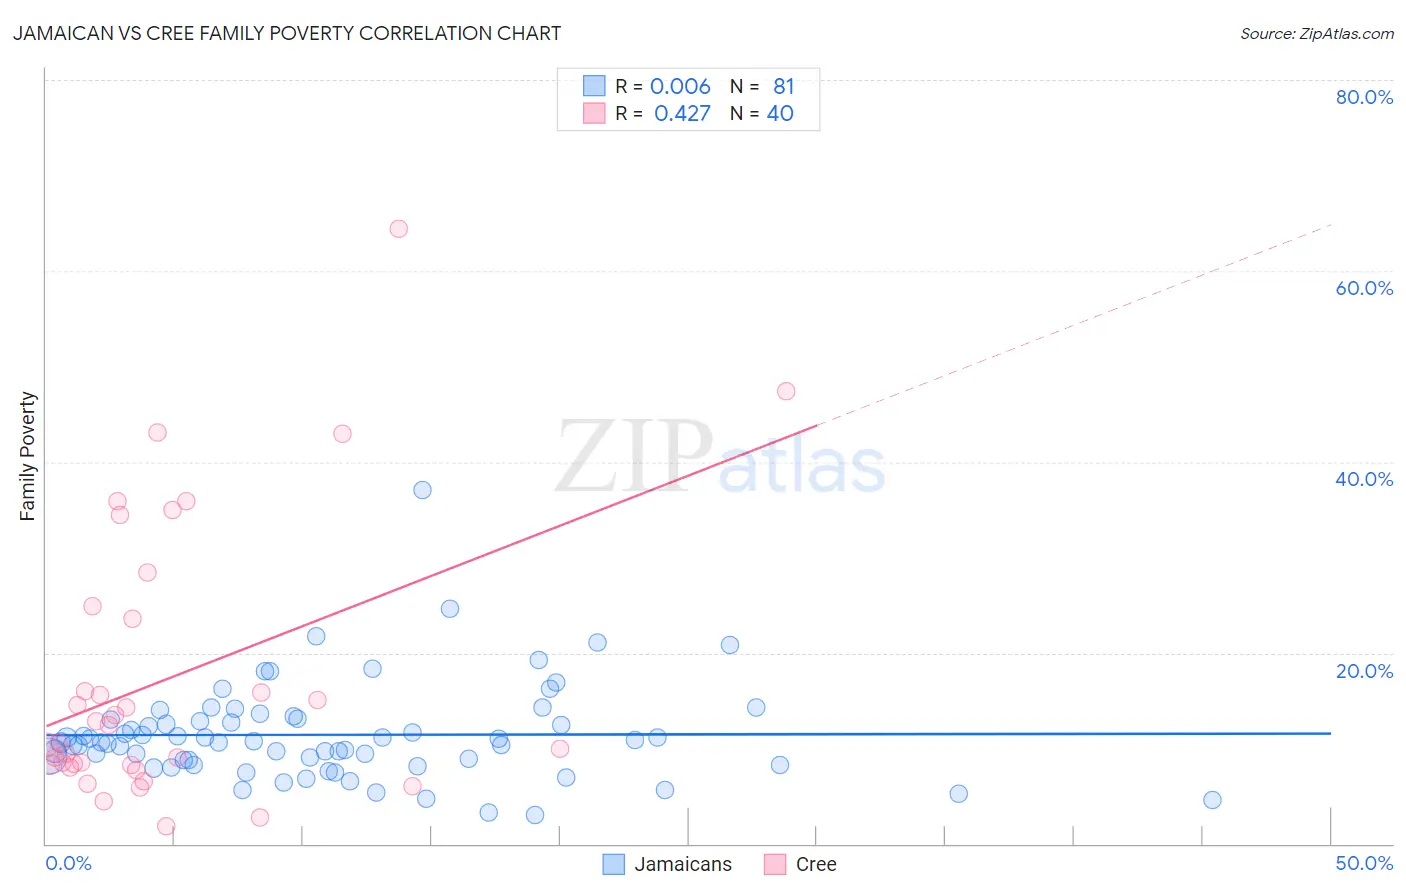
Jamaican vs Cree Family Poverty Correlation Chart
The statistical analysis conducted on geographies consisting of 367,005,969 people shows no correlation between the proportion of Jamaicans and poverty level among families in the United States with a correlation coefficient (R) of 0.006 and weighted average of 11.1%. Similarly, the statistical analysis conducted on geographies consisting of 76,172,191 people shows a moderate positive correlation between the proportion of Cree and poverty level among families in the United States with a correlation coefficient (R) of 0.427 and weighted average of 10.5%, a difference of 5.7%.
Family Poverty Correlation Summary
| Measurement | Jamaican | Cree |
| Minimum | 3.0% | 1.8% |
| Maximum | 37.0% | 64.4% |
| Range | 34.1% | 62.6% |
| Mean | 11.4% | 17.4% |
| Median | 10.6% | 11.6% |
| Interquartile 25% (IQ1) | 8.5% | 8.3% |
| Interquartile 75% (IQ3) | 13.1% | 24.2% |
| Interquartile Range (IQR) | 4.6% | 16.0% |
| Standard Deviation (Sample) | 5.1% | 14.4% |
| Standard Deviation (Population) | 5.1% | 14.2% |
Similar Demographics by Family Poverty
Demographics Similar to Jamaicans by Family Poverty
In terms of family poverty, the demographic groups most similar to Jamaicans are Comanche (11.0%, a difference of 0.10%), Immigrants from El Salvador (11.0%, a difference of 0.12%), Immigrants from Ecuador (11.1%, a difference of 0.48%), Immigrants from Nicaragua (11.1%, a difference of 0.49%), and Immigrants from Bahamas (11.1%, a difference of 0.73%).
| Demographics | Rating | Rank | Family Poverty |
| Shoshone | 0.2 /100 | #261 | Tragic 10.9% |
| Spanish American Indians | 0.2 /100 | #262 | Tragic 10.9% |
| Cape Verdeans | 0.1 /100 | #263 | Tragic 10.9% |
| Trinidadians and Tobagonians | 0.1 /100 | #264 | Tragic 10.9% |
| Immigrants | Trinidad and Tobago | 0.1 /100 | #265 | Tragic 10.9% |
| Immigrants | El Salvador | 0.1 /100 | #266 | Tragic 11.0% |
| Comanche | 0.1 /100 | #267 | Tragic 11.0% |
| Jamaicans | 0.1 /100 | #268 | Tragic 11.1% |
| Immigrants | Ecuador | 0.1 /100 | #269 | Tragic 11.1% |
| Immigrants | Nicaragua | 0.1 /100 | #270 | Tragic 11.1% |
| Immigrants | Bahamas | 0.1 /100 | #271 | Tragic 11.1% |
| Immigrants | Jamaica | 0.1 /100 | #272 | Tragic 11.2% |
| Somalis | 0.1 /100 | #273 | Tragic 11.2% |
| Spanish Americans | 0.1 /100 | #274 | Tragic 11.2% |
| Central Americans | 0.1 /100 | #275 | Tragic 11.2% |
Demographics Similar to Cree by Family Poverty
In terms of family poverty, the demographic groups most similar to Cree are Nepalese (10.4%, a difference of 0.46%), Immigrants from Burma/Myanmar (10.5%, a difference of 0.61%), Alaska Native (10.4%, a difference of 0.94%), Cherokee (10.6%, a difference of 1.3%), and Liberian (10.6%, a difference of 1.3%).
| Demographics | Rating | Rank | Family Poverty |
| Immigrants | Laos | 1.7 /100 | #237 | Tragic 10.2% |
| French American Indians | 1.5 /100 | #238 | Tragic 10.2% |
| Potawatomi | 1.5 /100 | #239 | Tragic 10.2% |
| Immigrants | Azores | 1.4 /100 | #240 | Tragic 10.3% |
| Ghanaians | 1.3 /100 | #241 | Tragic 10.3% |
| Alaska Natives | 1.0 /100 | #242 | Tragic 10.4% |
| Nepalese | 0.8 /100 | #243 | Tragic 10.4% |
| Cree | 0.7 /100 | #244 | Tragic 10.5% |
| Immigrants | Burma/Myanmar | 0.6 /100 | #245 | Tragic 10.5% |
| Cherokee | 0.5 /100 | #246 | Tragic 10.6% |
| Liberians | 0.4 /100 | #247 | Tragic 10.6% |
| Nicaraguans | 0.4 /100 | #248 | Tragic 10.6% |
| Cubans | 0.4 /100 | #249 | Tragic 10.6% |
| Salvadorans | 0.3 /100 | #250 | Tragic 10.7% |
| Iroquois | 0.3 /100 | #251 | Tragic 10.7% |