Immigrants from Romania vs Cree Family Poverty
COMPARE
Immigrants from Romania
Cree
Family Poverty
Family Poverty Comparison
Immigrants from Romania
Cree
7.8%
FAMILY POVERTY
98.2/ 100
METRIC RATING
72nd/ 347
METRIC RANK
10.5%
FAMILY POVERTY
0.7/ 100
METRIC RATING
244th/ 347
METRIC RANK
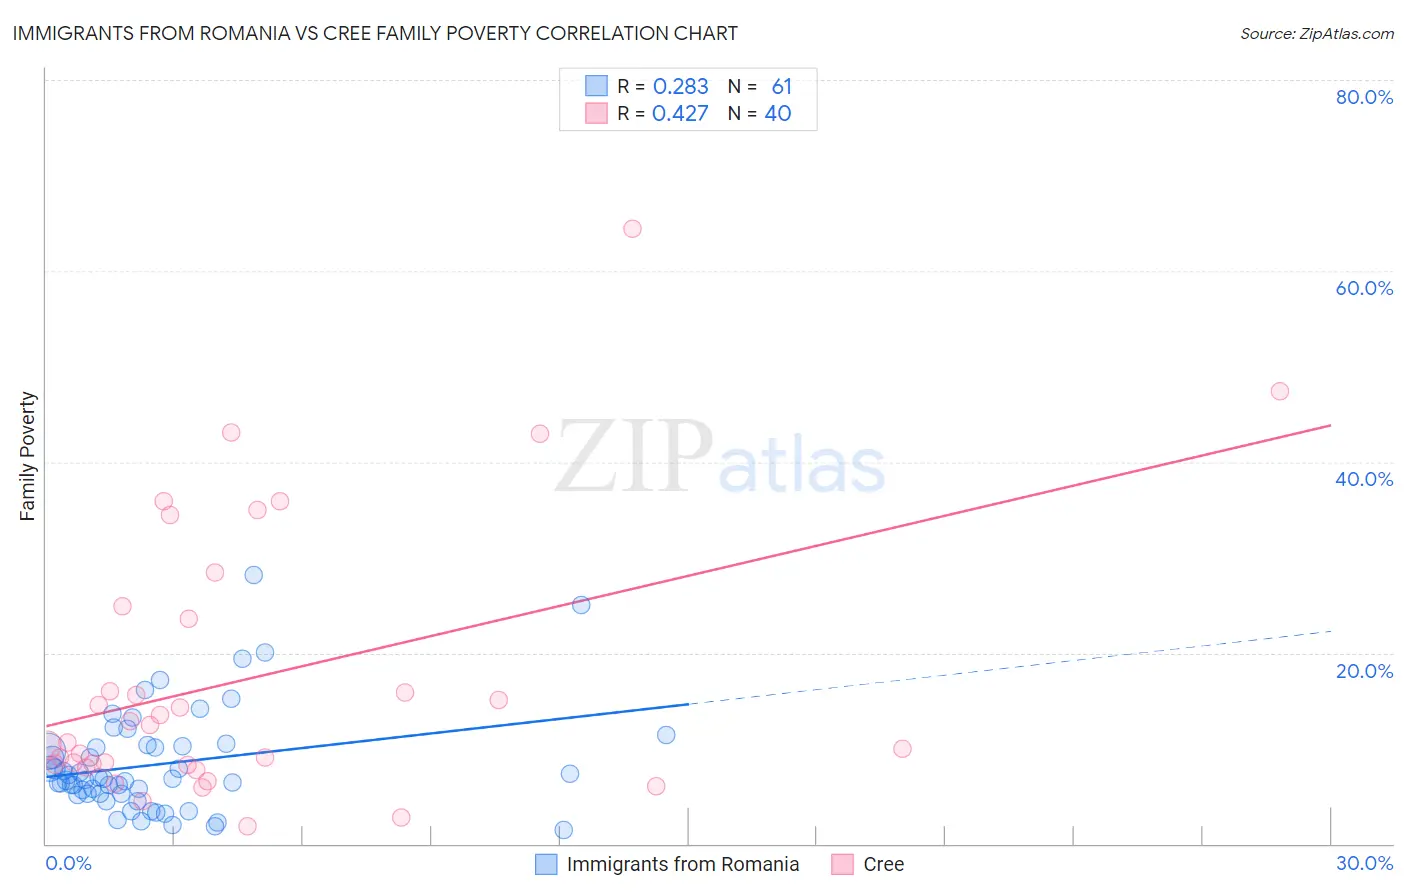
Immigrants from Romania vs Cree Family Poverty Correlation Chart
The statistical analysis conducted on geographies consisting of 256,635,029 people shows a weak positive correlation between the proportion of Immigrants from Romania and poverty level among families in the United States with a correlation coefficient (R) of 0.283 and weighted average of 7.8%. Similarly, the statistical analysis conducted on geographies consisting of 76,172,191 people shows a moderate positive correlation between the proportion of Cree and poverty level among families in the United States with a correlation coefficient (R) of 0.427 and weighted average of 10.5%, a difference of 33.7%.
Family Poverty Correlation Summary
| Measurement | Immigrants from Romania | Cree |
| Minimum | 1.4% | 1.8% |
| Maximum | 28.2% | 64.4% |
| Range | 26.8% | 62.6% |
| Mean | 8.4% | 17.4% |
| Median | 6.9% | 11.6% |
| Interquartile 25% (IQ1) | 5.2% | 8.3% |
| Interquartile 75% (IQ3) | 10.3% | 24.2% |
| Interquartile Range (IQR) | 5.1% | 16.0% |
| Standard Deviation (Sample) | 5.4% | 14.4% |
| Standard Deviation (Population) | 5.4% | 14.2% |
Similar Demographics by Family Poverty
Demographics Similar to Immigrants from Romania by Family Poverty
In terms of family poverty, the demographic groups most similar to Immigrants from Romania are Austrian (7.8%, a difference of 0.0%), Cambodian (7.8%, a difference of 0.060%), Immigrants from Canada (7.8%, a difference of 0.080%), Immigrants from China (7.8%, a difference of 0.080%), and Immigrants from Belgium (7.8%, a difference of 0.12%).
| Demographics | Rating | Rank | Family Poverty |
| Immigrants | Bulgaria | 98.3 /100 | #65 | Exceptional 7.8% |
| Dutch | 98.3 /100 | #66 | Exceptional 7.8% |
| Northern Europeans | 98.3 /100 | #67 | Exceptional 7.8% |
| Australians | 98.2 /100 | #68 | Exceptional 7.8% |
| Immigrants | Belgium | 98.2 /100 | #69 | Exceptional 7.8% |
| Immigrants | Canada | 98.2 /100 | #70 | Exceptional 7.8% |
| Cambodians | 98.2 /100 | #71 | Exceptional 7.8% |
| Immigrants | Romania | 98.2 /100 | #72 | Exceptional 7.8% |
| Austrians | 98.2 /100 | #73 | Exceptional 7.8% |
| Immigrants | China | 98.1 /100 | #74 | Exceptional 7.8% |
| Immigrants | Croatia | 98.1 /100 | #75 | Exceptional 7.8% |
| Immigrants | Latvia | 98.0 /100 | #76 | Exceptional 7.9% |
| Ukrainians | 98.0 /100 | #77 | Exceptional 7.9% |
| Immigrants | North America | 97.9 /100 | #78 | Exceptional 7.9% |
| Immigrants | Europe | 97.8 /100 | #79 | Exceptional 7.9% |
Demographics Similar to Cree by Family Poverty
In terms of family poverty, the demographic groups most similar to Cree are Nepalese (10.4%, a difference of 0.46%), Immigrants from Burma/Myanmar (10.5%, a difference of 0.61%), Alaska Native (10.4%, a difference of 0.94%), Cherokee (10.6%, a difference of 1.3%), and Liberian (10.6%, a difference of 1.3%).
| Demographics | Rating | Rank | Family Poverty |
| Immigrants | Laos | 1.7 /100 | #237 | Tragic 10.2% |
| French American Indians | 1.5 /100 | #238 | Tragic 10.2% |
| Potawatomi | 1.5 /100 | #239 | Tragic 10.2% |
| Immigrants | Azores | 1.4 /100 | #240 | Tragic 10.3% |
| Ghanaians | 1.3 /100 | #241 | Tragic 10.3% |
| Alaska Natives | 1.0 /100 | #242 | Tragic 10.4% |
| Nepalese | 0.8 /100 | #243 | Tragic 10.4% |
| Cree | 0.7 /100 | #244 | Tragic 10.5% |
| Immigrants | Burma/Myanmar | 0.6 /100 | #245 | Tragic 10.5% |
| Cherokee | 0.5 /100 | #246 | Tragic 10.6% |
| Liberians | 0.4 /100 | #247 | Tragic 10.6% |
| Nicaraguans | 0.4 /100 | #248 | Tragic 10.6% |
| Cubans | 0.4 /100 | #249 | Tragic 10.6% |
| Salvadorans | 0.3 /100 | #250 | Tragic 10.7% |
| Iroquois | 0.3 /100 | #251 | Tragic 10.7% |