Dominican vs Cree Family Poverty
COMPARE
Dominican
Cree
Family Poverty
Family Poverty Comparison
Dominicans
Cree
14.3%
FAMILY POVERTY
0.0/ 100
METRIC RATING
332nd/ 347
METRIC RANK
10.5%
FAMILY POVERTY
0.7/ 100
METRIC RATING
244th/ 347
METRIC RANK
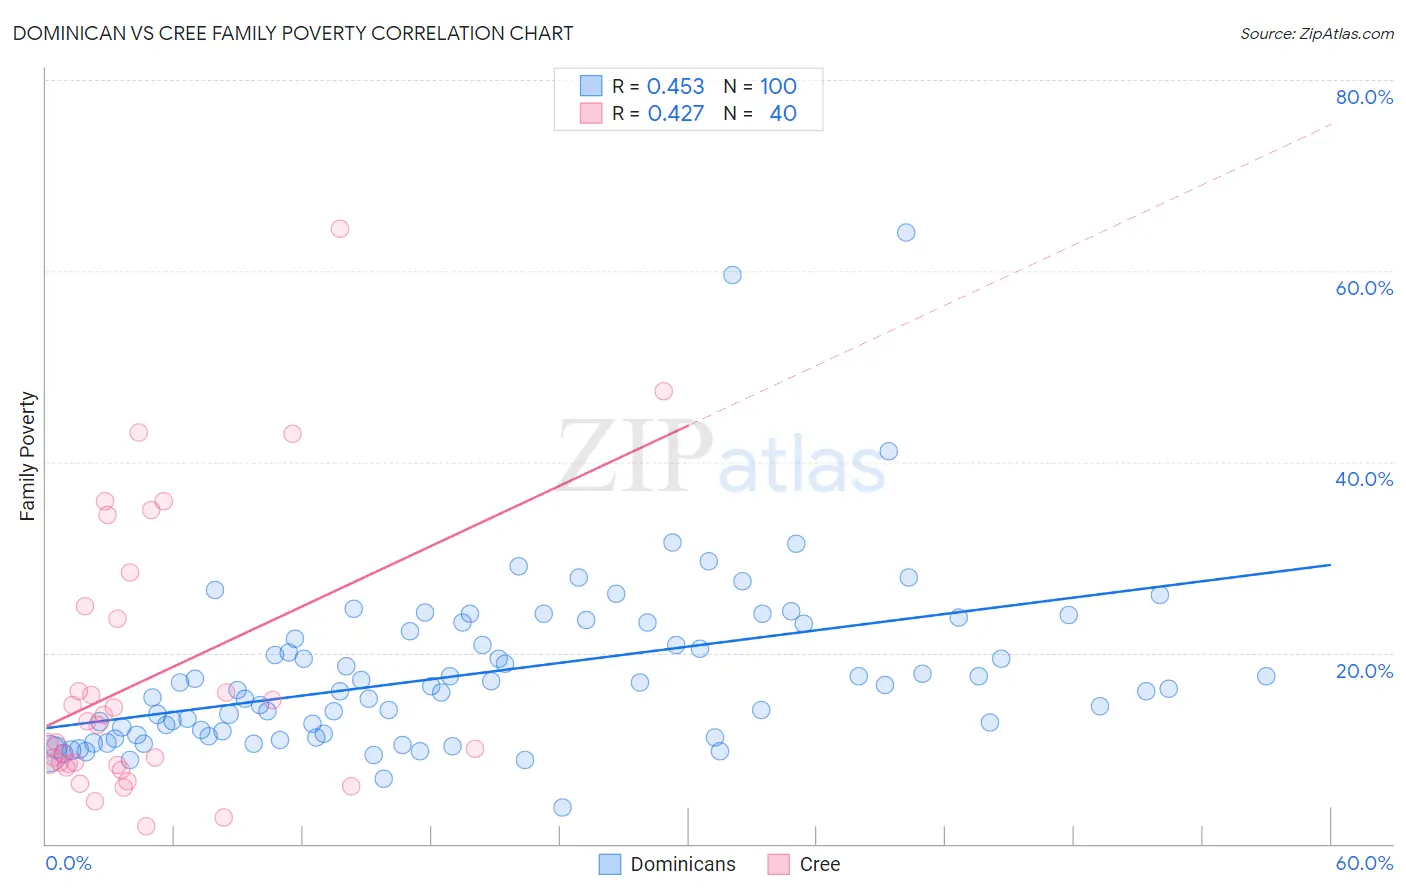
Dominican vs Cree Family Poverty Correlation Chart
The statistical analysis conducted on geographies consisting of 353,965,759 people shows a moderate positive correlation between the proportion of Dominicans and poverty level among families in the United States with a correlation coefficient (R) of 0.453 and weighted average of 14.3%. Similarly, the statistical analysis conducted on geographies consisting of 76,172,191 people shows a moderate positive correlation between the proportion of Cree and poverty level among families in the United States with a correlation coefficient (R) of 0.427 and weighted average of 10.5%, a difference of 37.1%.
Family Poverty Correlation Summary
| Measurement | Dominican | Cree |
| Minimum | 3.8% | 1.8% |
| Maximum | 64.0% | 64.4% |
| Range | 60.2% | 62.6% |
| Mean | 17.9% | 17.4% |
| Median | 16.1% | 11.6% |
| Interquartile 25% (IQ1) | 11.4% | 8.3% |
| Interquartile 75% (IQ3) | 22.6% | 24.2% |
| Interquartile Range (IQR) | 11.2% | 16.0% |
| Standard Deviation (Sample) | 9.1% | 14.4% |
| Standard Deviation (Population) | 9.1% | 14.2% |
Similar Demographics by Family Poverty
Demographics Similar to Dominicans by Family Poverty
In terms of family poverty, the demographic groups most similar to Dominicans are Cheyenne (14.3%, a difference of 0.44%), Native/Alaskan (14.3%, a difference of 0.58%), Immigrants from Dominican Republic (14.4%, a difference of 0.63%), Houma (14.6%, a difference of 1.9%), and Apache (14.7%, a difference of 2.8%).
| Demographics | Rating | Rank | Family Poverty |
| Paiute | 0.0 /100 | #325 | Tragic 13.0% |
| Colville | 0.0 /100 | #326 | Tragic 13.0% |
| Yakama | 0.0 /100 | #327 | Tragic 13.1% |
| Central American Indians | 0.0 /100 | #328 | Tragic 13.3% |
| Blacks/African Americans | 0.0 /100 | #329 | Tragic 13.3% |
| Natives/Alaskans | 0.0 /100 | #330 | Tragic 14.3% |
| Cheyenne | 0.0 /100 | #331 | Tragic 14.3% |
| Dominicans | 0.0 /100 | #332 | Tragic 14.3% |
| Immigrants | Dominican Republic | 0.0 /100 | #333 | Tragic 14.4% |
| Houma | 0.0 /100 | #334 | Tragic 14.6% |
| Apache | 0.0 /100 | #335 | Tragic 14.7% |
| Sioux | 0.0 /100 | #336 | Tragic 15.9% |
| Hopi | 0.0 /100 | #337 | Tragic 15.9% |
| Crow | 0.0 /100 | #338 | Tragic 16.1% |
| Yuman | 0.0 /100 | #339 | Tragic 16.6% |
Demographics Similar to Cree by Family Poverty
In terms of family poverty, the demographic groups most similar to Cree are Nepalese (10.4%, a difference of 0.46%), Immigrants from Burma/Myanmar (10.5%, a difference of 0.61%), Alaska Native (10.4%, a difference of 0.94%), Cherokee (10.6%, a difference of 1.3%), and Liberian (10.6%, a difference of 1.3%).
| Demographics | Rating | Rank | Family Poverty |
| Immigrants | Laos | 1.7 /100 | #237 | Tragic 10.2% |
| French American Indians | 1.5 /100 | #238 | Tragic 10.2% |
| Potawatomi | 1.5 /100 | #239 | Tragic 10.2% |
| Immigrants | Azores | 1.4 /100 | #240 | Tragic 10.3% |
| Ghanaians | 1.3 /100 | #241 | Tragic 10.3% |
| Alaska Natives | 1.0 /100 | #242 | Tragic 10.4% |
| Nepalese | 0.8 /100 | #243 | Tragic 10.4% |
| Cree | 0.7 /100 | #244 | Tragic 10.5% |
| Immigrants | Burma/Myanmar | 0.6 /100 | #245 | Tragic 10.5% |
| Cherokee | 0.5 /100 | #246 | Tragic 10.6% |
| Liberians | 0.4 /100 | #247 | Tragic 10.6% |
| Nicaraguans | 0.4 /100 | #248 | Tragic 10.6% |
| Cubans | 0.4 /100 | #249 | Tragic 10.6% |
| Salvadorans | 0.3 /100 | #250 | Tragic 10.7% |
| Iroquois | 0.3 /100 | #251 | Tragic 10.7% |