Latvian vs Finnish Female Poverty
COMPARE
Latvian
Finnish
Female Poverty
Female Poverty Comparison
Latvians
Finns
11.4%
FEMALE POVERTY
99.8/ 100
METRIC RATING
15th/ 347
METRIC RANK
12.4%
FEMALE POVERTY
96.4/ 100
METRIC RATING
88th/ 347
METRIC RANK
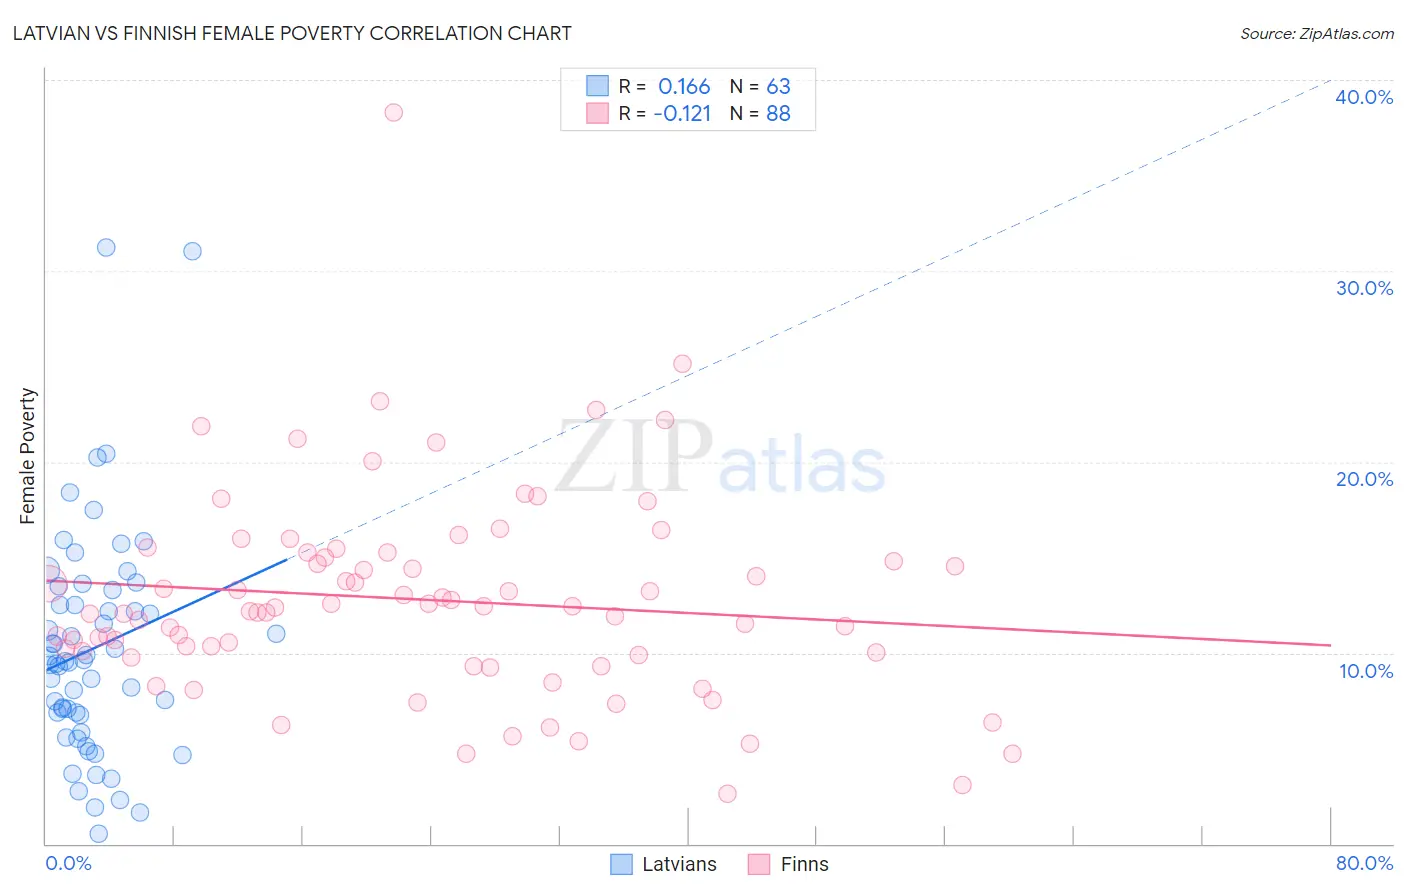
Latvian vs Finnish Female Poverty Correlation Chart
The statistical analysis conducted on geographies consisting of 220,618,449 people shows a poor positive correlation between the proportion of Latvians and poverty level among females in the United States with a correlation coefficient (R) of 0.166 and weighted average of 11.4%. Similarly, the statistical analysis conducted on geographies consisting of 404,419,462 people shows a poor negative correlation between the proportion of Finns and poverty level among females in the United States with a correlation coefficient (R) of -0.121 and weighted average of 12.4%, a difference of 8.3%.
Female Poverty Correlation Summary
| Measurement | Latvian | Finnish |
| Minimum | 0.50% | 2.6% |
| Maximum | 31.3% | 38.3% |
| Range | 30.8% | 35.7% |
| Mean | 10.2% | 12.8% |
| Median | 9.6% | 12.3% |
| Interquartile 25% (IQ1) | 6.7% | 9.9% |
| Interquartile 75% (IQ3) | 13.3% | 15.1% |
| Interquartile Range (IQR) | 6.5% | 5.2% |
| Standard Deviation (Sample) | 5.9% | 5.4% |
| Standard Deviation (Population) | 5.9% | 5.3% |
Similar Demographics by Female Poverty
Demographics Similar to Latvians by Female Poverty
In terms of female poverty, the demographic groups most similar to Latvians are Lithuanian (11.4%, a difference of 0.32%), Immigrants from Bolivia (11.5%, a difference of 0.47%), Bolivian (11.5%, a difference of 0.54%), Immigrants from Scotland (11.5%, a difference of 0.59%), and Norwegian (11.5%, a difference of 0.64%).
| Demographics | Rating | Rank | Female Poverty |
| Immigrants | South Central Asia | 99.9 /100 | #8 | Exceptional 11.1% |
| Bulgarians | 99.9 /100 | #9 | Exceptional 11.1% |
| Immigrants | Hong Kong | 99.9 /100 | #10 | Exceptional 11.2% |
| Maltese | 99.9 /100 | #11 | Exceptional 11.2% |
| Bhutanese | 99.9 /100 | #12 | Exceptional 11.3% |
| Immigrants | Lithuania | 99.9 /100 | #13 | Exceptional 11.3% |
| Lithuanians | 99.8 /100 | #14 | Exceptional 11.4% |
| Latvians | 99.8 /100 | #15 | Exceptional 11.4% |
| Immigrants | Bolivia | 99.8 /100 | #16 | Exceptional 11.5% |
| Bolivians | 99.8 /100 | #17 | Exceptional 11.5% |
| Immigrants | Scotland | 99.8 /100 | #18 | Exceptional 11.5% |
| Norwegians | 99.8 /100 | #19 | Exceptional 11.5% |
| Eastern Europeans | 99.7 /100 | #20 | Exceptional 11.5% |
| Italians | 99.7 /100 | #21 | Exceptional 11.6% |
| Swedes | 99.7 /100 | #22 | Exceptional 11.6% |
Demographics Similar to Finns by Female Poverty
In terms of female poverty, the demographic groups most similar to Finns are Okinawan (12.4%, a difference of 0.050%), Dutch (12.4%, a difference of 0.060%), Irish (12.4%, a difference of 0.090%), Northern European (12.4%, a difference of 0.15%), and English (12.4%, a difference of 0.20%).
| Demographics | Rating | Rank | Female Poverty |
| Immigrants | Sweden | 97.1 /100 | #81 | Exceptional 12.3% |
| Jordanians | 97.1 /100 | #82 | Exceptional 12.3% |
| Immigrants | England | 96.9 /100 | #83 | Exceptional 12.3% |
| Northern Europeans | 96.6 /100 | #84 | Exceptional 12.4% |
| Irish | 96.5 /100 | #85 | Exceptional 12.4% |
| Dutch | 96.5 /100 | #86 | Exceptional 12.4% |
| Okinawans | 96.4 /100 | #87 | Exceptional 12.4% |
| Finns | 96.4 /100 | #88 | Exceptional 12.4% |
| English | 96.1 /100 | #89 | Exceptional 12.4% |
| Immigrants | Denmark | 95.8 /100 | #90 | Exceptional 12.4% |
| Belgians | 95.8 /100 | #91 | Exceptional 12.4% |
| Czechoslovakians | 95.7 /100 | #92 | Exceptional 12.4% |
| Immigrants | Egypt | 95.5 /100 | #93 | Exceptional 12.5% |
| Immigrants | Indonesia | 95.4 /100 | #94 | Exceptional 12.5% |
| Immigrants | South Africa | 95.4 /100 | #95 | Exceptional 12.5% |