Latvian vs Immigrants from South Africa Unemployment Among Ages 35 to 44 years
COMPARE
Latvian
Immigrants from South Africa
Unemployment Among Ages 35 to 44 years
Unemployment Among Ages 35 to 44 years Comparison
Latvians
Immigrants from South Africa
4.2%
UNEMPLOYMENT AMONG AGES 35 TO 44 YEARS
99.8/ 100
METRIC RATING
18th/ 347
METRIC RANK
4.5%
UNEMPLOYMENT AMONG AGES 35 TO 44 YEARS
86.8/ 100
METRIC RATING
121st/ 347
METRIC RANK
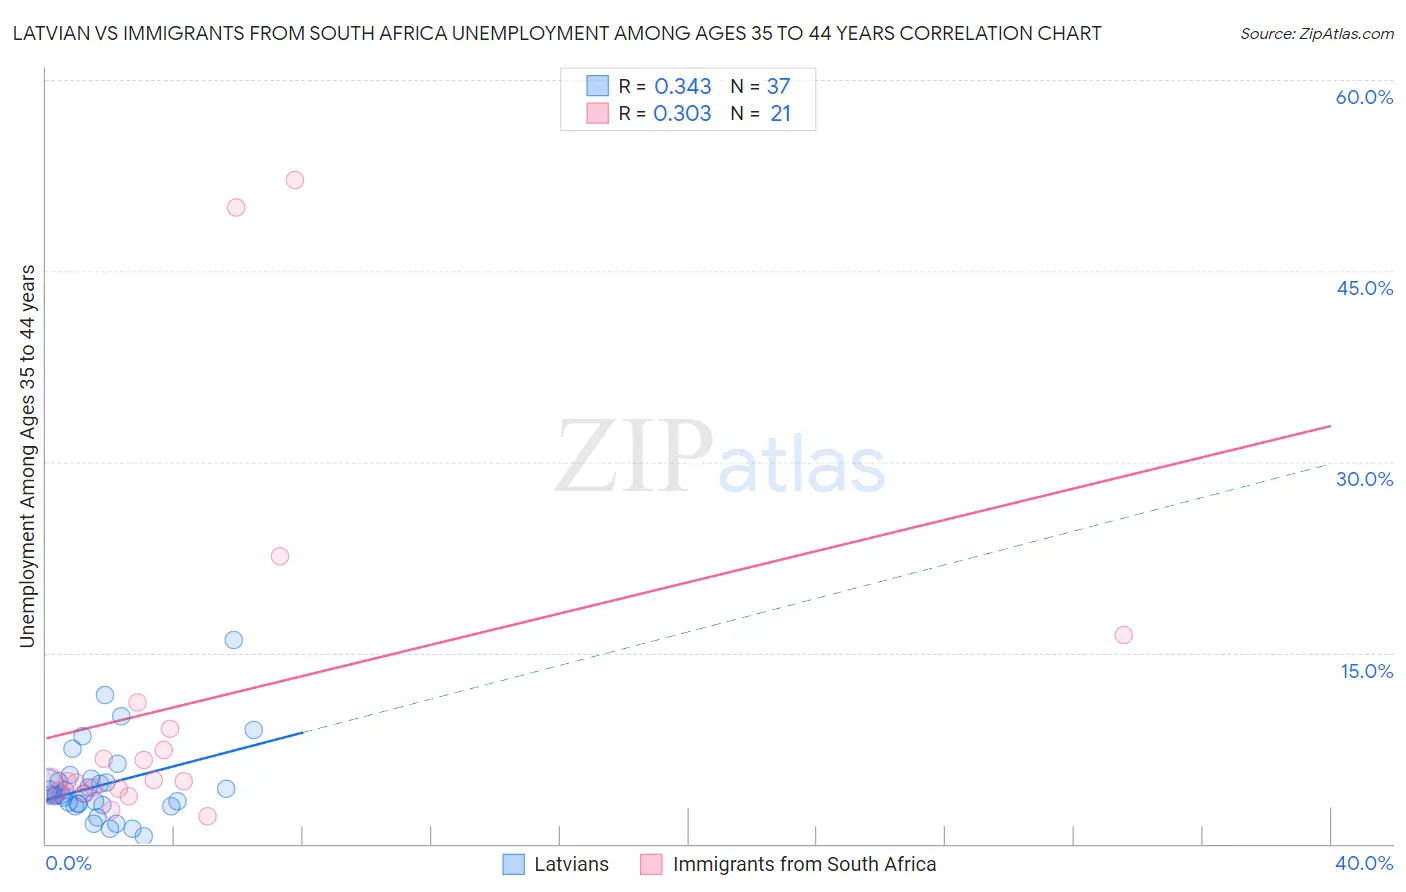
Latvian vs Immigrants from South Africa Unemployment Among Ages 35 to 44 years Correlation Chart
The statistical analysis conducted on geographies consisting of 217,581,244 people shows a mild positive correlation between the proportion of Latvians and unemployment rate among population between the ages 35 and 44 in the United States with a correlation coefficient (R) of 0.343 and weighted average of 4.2%. Similarly, the statistical analysis conducted on geographies consisting of 230,101,177 people shows a mild positive correlation between the proportion of Immigrants from South Africa and unemployment rate among population between the ages 35 and 44 in the United States with a correlation coefficient (R) of 0.303 and weighted average of 4.5%, a difference of 8.4%.
Unemployment Among Ages 35 to 44 years Correlation Summary
| Measurement | Latvian | Immigrants from South Africa |
| Minimum | 0.60% | 2.2% |
| Maximum | 16.0% | 52.1% |
| Range | 15.4% | 49.9% |
| Mean | 4.6% | 11.0% |
| Median | 3.9% | 5.0% |
| Interquartile 25% (IQ1) | 3.1% | 4.2% |
| Interquartile 75% (IQ3) | 5.0% | 10.1% |
| Interquartile Range (IQR) | 1.9% | 5.9% |
| Standard Deviation (Sample) | 3.1% | 14.1% |
| Standard Deviation (Population) | 3.0% | 13.8% |
Similar Demographics by Unemployment Among Ages 35 to 44 years
Demographics Similar to Latvians by Unemployment Among Ages 35 to 44 years
In terms of unemployment among ages 35 to 44 years, the demographic groups most similar to Latvians are Swedish (4.2%, a difference of 0.010%), Cuban (4.2%, a difference of 0.020%), Immigrants from Nepal (4.2%, a difference of 0.27%), Immigrants from Bolivia (4.2%, a difference of 0.52%), and Tongan (4.2%, a difference of 0.79%).
| Demographics | Rating | Rank | Unemployment Among Ages 35 to 44 years |
| Sudanese | 99.9 /100 | #11 | Exceptional 4.1% |
| Venezuelans | 99.9 /100 | #12 | Exceptional 4.1% |
| Bolivians | 99.9 /100 | #13 | Exceptional 4.1% |
| Czechs | 99.9 /100 | #14 | Exceptional 4.1% |
| Tongans | 99.8 /100 | #15 | Exceptional 4.2% |
| Cubans | 99.8 /100 | #16 | Exceptional 4.2% |
| Swedes | 99.8 /100 | #17 | Exceptional 4.2% |
| Latvians | 99.8 /100 | #18 | Exceptional 4.2% |
| Immigrants | Nepal | 99.7 /100 | #19 | Exceptional 4.2% |
| Immigrants | Bolivia | 99.7 /100 | #20 | Exceptional 4.2% |
| Paraguayans | 99.6 /100 | #21 | Exceptional 4.2% |
| Scandinavians | 99.5 /100 | #22 | Exceptional 4.2% |
| Immigrants | Kuwait | 99.5 /100 | #23 | Exceptional 4.3% |
| Tlingit-Haida | 99.5 /100 | #24 | Exceptional 4.3% |
| Bulgarians | 99.3 /100 | #25 | Exceptional 4.3% |
Demographics Similar to Immigrants from South Africa by Unemployment Among Ages 35 to 44 years
In terms of unemployment among ages 35 to 44 years, the demographic groups most similar to Immigrants from South Africa are Sri Lankan (4.5%, a difference of 0.0%), Ethiopian (4.5%, a difference of 0.040%), Basque (4.5%, a difference of 0.080%), Nicaraguan (4.5%, a difference of 0.12%), and Immigrants from Spain (4.5%, a difference of 0.12%).
| Demographics | Rating | Rank | Unemployment Among Ages 35 to 44 years |
| Macedonians | 88.3 /100 | #114 | Excellent 4.5% |
| Maltese | 88.1 /100 | #115 | Excellent 4.5% |
| Immigrants | Israel | 88.1 /100 | #116 | Excellent 4.5% |
| Immigrants | Greece | 87.9 /100 | #117 | Excellent 4.5% |
| Irish | 87.9 /100 | #118 | Excellent 4.5% |
| Nicaraguans | 87.6 /100 | #119 | Excellent 4.5% |
| Ethiopians | 87.1 /100 | #120 | Excellent 4.5% |
| Immigrants | South Africa | 86.8 /100 | #121 | Excellent 4.5% |
| Sri Lankans | 86.8 /100 | #122 | Excellent 4.5% |
| Basques | 86.3 /100 | #123 | Excellent 4.5% |
| Immigrants | Spain | 86.1 /100 | #124 | Excellent 4.5% |
| Immigrants | Northern Africa | 86.1 /100 | #125 | Excellent 4.5% |
| Immigrants | Austria | 84.7 /100 | #126 | Excellent 4.5% |
| Immigrants | Ethiopia | 84.7 /100 | #127 | Excellent 4.5% |
| Czechoslovakians | 83.4 /100 | #128 | Excellent 4.6% |