Cheyenne vs Immigrants from Dominica Single Female Poverty
COMPARE
Cheyenne
Immigrants from Dominica
Single Female Poverty
Single Female Poverty Comparison
Cheyenne
Immigrants from Dominica
30.4%
SINGLE FEMALE POVERTY
0.0/ 100
METRIC RATING
339th/ 347
METRIC RANK
23.9%
SINGLE FEMALE POVERTY
0.0/ 100
METRIC RATING
284th/ 347
METRIC RANK
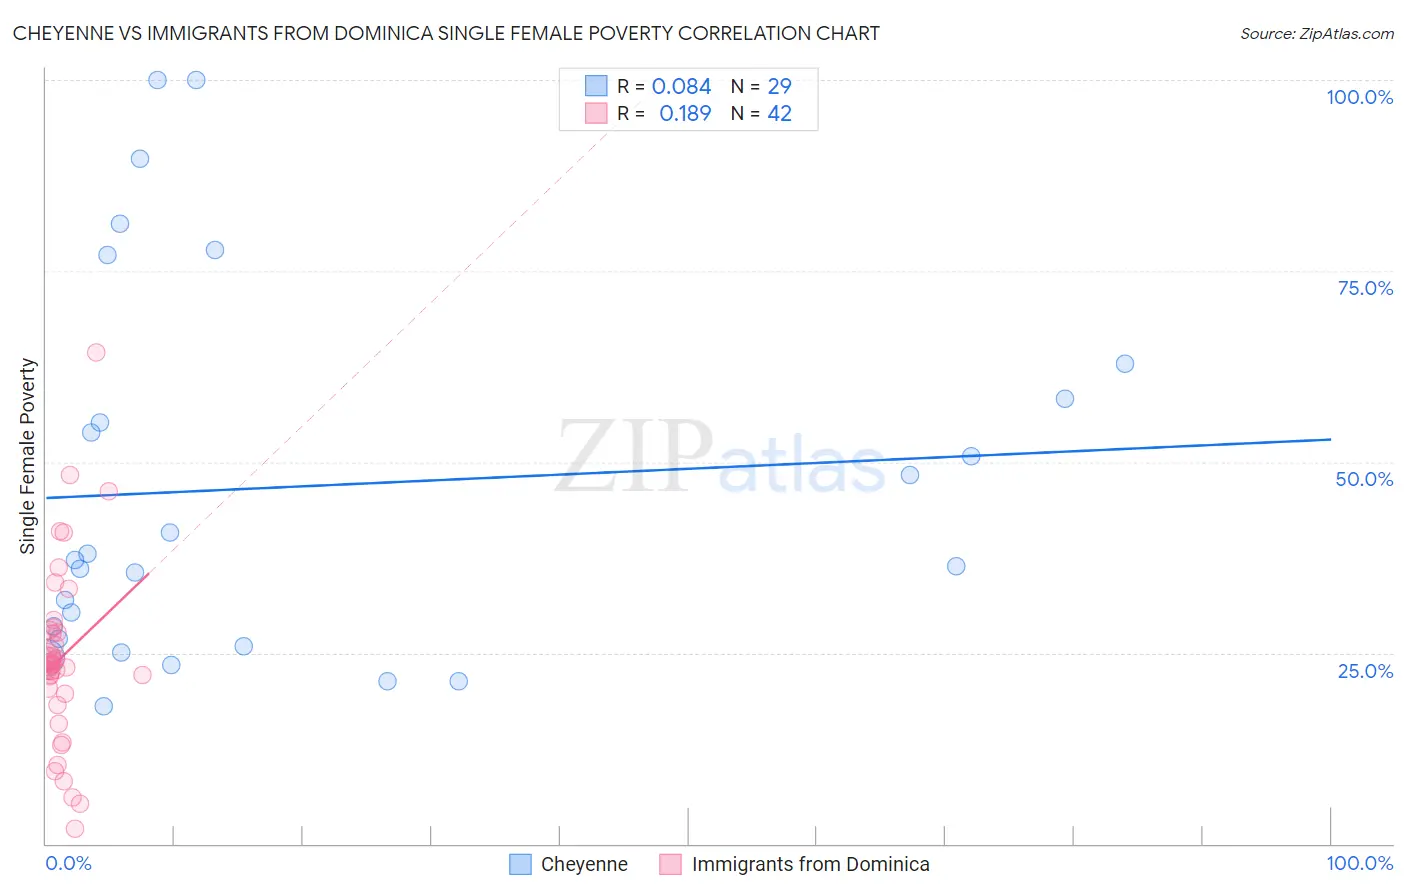
Cheyenne vs Immigrants from Dominica Single Female Poverty Correlation Chart
The statistical analysis conducted on geographies consisting of 80,467,038 people shows a slight positive correlation between the proportion of Cheyenne and poverty level among single females in the United States with a correlation coefficient (R) of 0.084 and weighted average of 30.4%. Similarly, the statistical analysis conducted on geographies consisting of 83,649,694 people shows a poor positive correlation between the proportion of Immigrants from Dominica and poverty level among single females in the United States with a correlation coefficient (R) of 0.189 and weighted average of 23.9%, a difference of 27.1%.
Single Female Poverty Correlation Summary
| Measurement | Cheyenne | Immigrants from Dominica |
| Minimum | 18.0% | 2.0% |
| Maximum | 100.0% | 64.4% |
| Range | 82.0% | 62.4% |
| Mean | 46.7% | 24.4% |
| Median | 37.1% | 23.5% |
| Interquartile 25% (IQ1) | 26.3% | 19.7% |
| Interquartile 75% (IQ3) | 60.6% | 28.1% |
| Interquartile Range (IQR) | 34.3% | 8.4% |
| Standard Deviation (Sample) | 24.6% | 12.0% |
| Standard Deviation (Population) | 24.2% | 11.9% |
Similar Demographics by Single Female Poverty
Demographics Similar to Cheyenne by Single Female Poverty
In terms of single female poverty, the demographic groups most similar to Cheyenne are Pima (30.3%, a difference of 0.22%), Cajun (30.6%, a difference of 0.81%), Sioux (31.3%, a difference of 2.8%), Yuman (29.4%, a difference of 3.2%), and Navajo (31.7%, a difference of 4.1%).
| Demographics | Rating | Rank | Single Female Poverty |
| Yakama | 0.0 /100 | #332 | Tragic 28.3% |
| Ute | 0.0 /100 | #333 | Tragic 28.4% |
| Pueblo | 0.0 /100 | #334 | Tragic 28.6% |
| Immigrants | Yemen | 0.0 /100 | #335 | Tragic 28.9% |
| Colville | 0.0 /100 | #336 | Tragic 29.1% |
| Yuman | 0.0 /100 | #337 | Tragic 29.4% |
| Pima | 0.0 /100 | #338 | Tragic 30.3% |
| Cheyenne | 0.0 /100 | #339 | Tragic 30.4% |
| Cajuns | 0.0 /100 | #340 | Tragic 30.6% |
| Sioux | 0.0 /100 | #341 | Tragic 31.3% |
| Navajo | 0.0 /100 | #342 | Tragic 31.7% |
| Crow | 0.0 /100 | #343 | Tragic 32.4% |
| Lumbee | 0.0 /100 | #344 | Tragic 33.0% |
| Houma | 0.0 /100 | #345 | Tragic 33.8% |
| Puerto Ricans | 0.0 /100 | #346 | Tragic 34.1% |
Demographics Similar to Immigrants from Dominica by Single Female Poverty
In terms of single female poverty, the demographic groups most similar to Immigrants from Dominica are German Russian (23.9%, a difference of 0.11%), Guatemalan (23.8%, a difference of 0.25%), Immigrants from Zaire (23.8%, a difference of 0.31%), Immigrants from Latin America (23.7%, a difference of 0.82%), and Immigrants from Guatemala (24.1%, a difference of 0.86%).
| Demographics | Rating | Rank | Single Female Poverty |
| Pennsylvania Germans | 0.0 /100 | #277 | Tragic 23.6% |
| Immigrants | Nonimmigrants | 0.0 /100 | #278 | Tragic 23.6% |
| Alaskan Athabascans | 0.0 /100 | #279 | Tragic 23.6% |
| Immigrants | Latin America | 0.0 /100 | #280 | Tragic 23.7% |
| Immigrants | Zaire | 0.0 /100 | #281 | Tragic 23.8% |
| Guatemalans | 0.0 /100 | #282 | Tragic 23.8% |
| German Russians | 0.0 /100 | #283 | Tragic 23.9% |
| Immigrants | Dominica | 0.0 /100 | #284 | Tragic 23.9% |
| Immigrants | Guatemala | 0.0 /100 | #285 | Tragic 24.1% |
| Cree | 0.0 /100 | #286 | Tragic 24.1% |
| Bangladeshis | 0.0 /100 | #287 | Tragic 24.2% |
| Spanish Americans | 0.0 /100 | #288 | Tragic 24.2% |
| U.S. Virgin Islanders | 0.0 /100 | #289 | Tragic 24.2% |
| Indonesians | 0.0 /100 | #290 | Tragic 24.3% |
| Osage | 0.0 /100 | #291 | Tragic 24.4% |