Kiowa vs Immigrants from Dominica Professional Degree
COMPARE
Kiowa
Immigrants from Dominica
Professional Degree
Professional Degree Comparison
Kiowa
Immigrants from Dominica
3.1%
PROFESSIONAL DEGREE
0.0/ 100
METRIC RATING
331st/ 347
METRIC RANK
3.6%
PROFESSIONAL DEGREE
0.5/ 100
METRIC RATING
275th/ 347
METRIC RANK
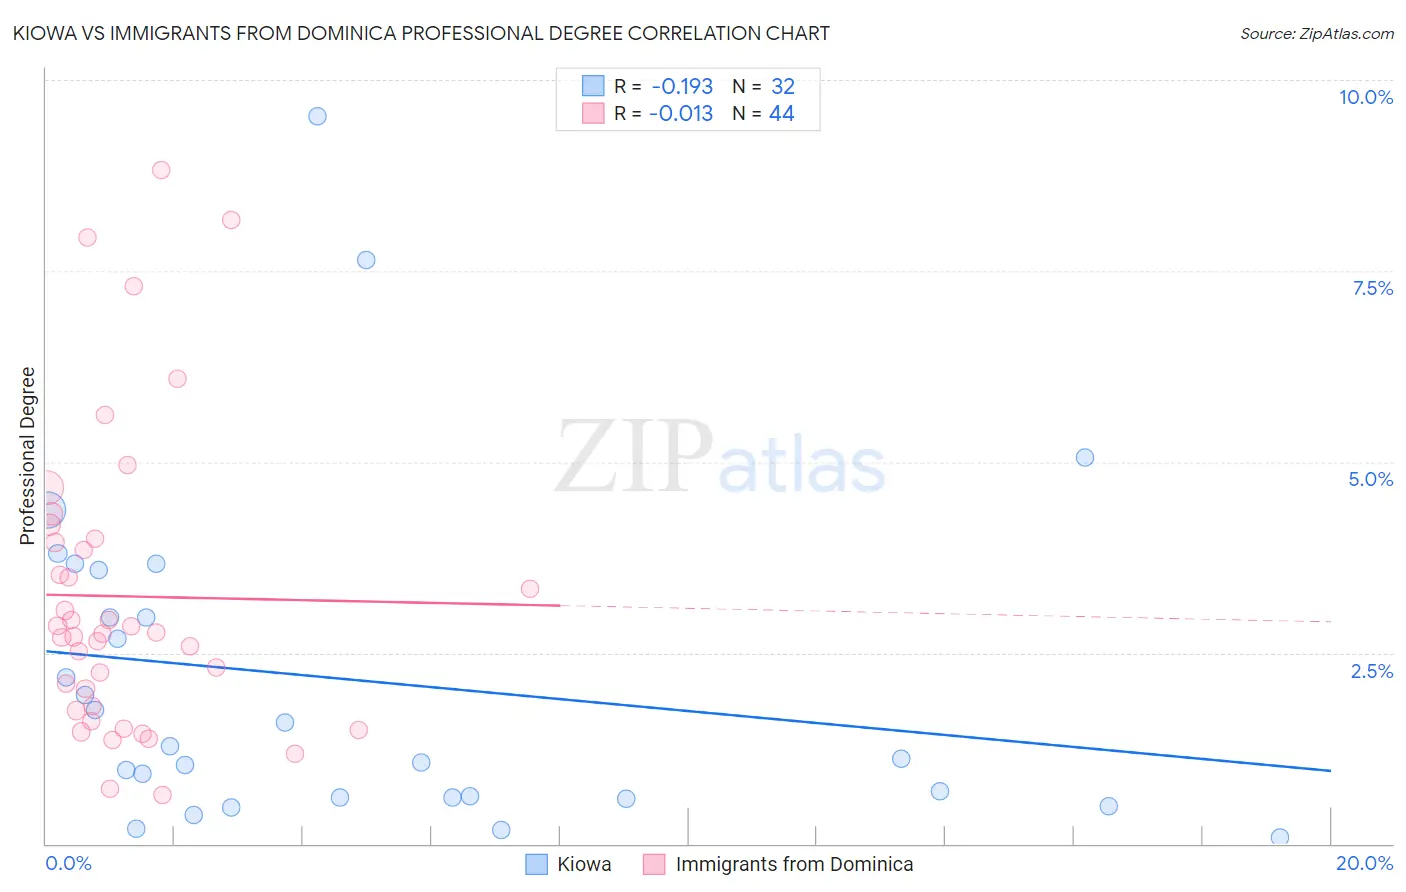
Kiowa vs Immigrants from Dominica Professional Degree Correlation Chart
The statistical analysis conducted on geographies consisting of 56,015,287 people shows a poor negative correlation between the proportion of Kiowa and percentage of population with at least professional degree education in the United States with a correlation coefficient (R) of -0.193 and weighted average of 3.1%. Similarly, the statistical analysis conducted on geographies consisting of 83,774,697 people shows no correlation between the proportion of Immigrants from Dominica and percentage of population with at least professional degree education in the United States with a correlation coefficient (R) of -0.013 and weighted average of 3.6%, a difference of 15.2%.
Professional Degree Correlation Summary
| Measurement | Kiowa | Immigrants from Dominica |
| Minimum | 0.082% | 0.64% |
| Maximum | 9.5% | 8.8% |
| Range | 9.4% | 8.2% |
| Mean | 2.1% | 3.2% |
| Median | 1.2% | 2.8% |
| Interquartile 25% (IQ1) | 0.60% | 1.8% |
| Interquartile 75% (IQ3) | 3.3% | 4.0% |
| Interquartile Range (IQR) | 2.7% | 2.2% |
| Standard Deviation (Sample) | 2.2% | 2.0% |
| Standard Deviation (Population) | 2.2% | 2.0% |
Similar Demographics by Professional Degree
Demographics Similar to Kiowa by Professional Degree
In terms of professional degree, the demographic groups most similar to Kiowa are Yakama (3.1%, a difference of 0.11%), Immigrants from Cabo Verde (3.1%, a difference of 0.12%), Puget Sound Salish (3.1%, a difference of 0.14%), Bangladeshi (3.1%, a difference of 0.20%), and Creek (3.1%, a difference of 0.41%).
| Demographics | Rating | Rank | Professional Degree |
| Crow | 0.0 /100 | #324 | Tragic 3.2% |
| Yaqui | 0.0 /100 | #325 | Tragic 3.2% |
| Menominee | 0.0 /100 | #326 | Tragic 3.1% |
| Dutch West Indians | 0.0 /100 | #327 | Tragic 3.1% |
| Creek | 0.0 /100 | #328 | Tragic 3.1% |
| Bangladeshis | 0.0 /100 | #329 | Tragic 3.1% |
| Immigrants | Cabo Verde | 0.0 /100 | #330 | Tragic 3.1% |
| Kiowa | 0.0 /100 | #331 | Tragic 3.1% |
| Yakama | 0.0 /100 | #332 | Tragic 3.1% |
| Puget Sound Salish | 0.0 /100 | #333 | Tragic 3.1% |
| Pennsylvania Germans | 0.0 /100 | #334 | Tragic 3.0% |
| Natives/Alaskans | 0.0 /100 | #335 | Tragic 3.0% |
| Fijians | 0.0 /100 | #336 | Tragic 2.9% |
| Arapaho | 0.0 /100 | #337 | Tragic 2.9% |
| Navajo | 0.0 /100 | #338 | Tragic 2.9% |
Demographics Similar to Immigrants from Dominica by Professional Degree
In terms of professional degree, the demographic groups most similar to Immigrants from Dominica are Liberian (3.6%, a difference of 0.050%), Cheyenne (3.6%, a difference of 0.060%), Japanese (3.5%, a difference of 0.12%), Immigrants from Portugal (3.5%, a difference of 0.16%), and Dominican (3.5%, a difference of 0.20%).
| Demographics | Rating | Rank | Professional Degree |
| Aleuts | 0.7 /100 | #268 | Tragic 3.6% |
| Immigrants | Cuba | 0.6 /100 | #269 | Tragic 3.6% |
| Central Americans | 0.6 /100 | #270 | Tragic 3.6% |
| Belizeans | 0.5 /100 | #271 | Tragic 3.6% |
| Immigrants | Jamaica | 0.5 /100 | #272 | Tragic 3.6% |
| Americans | 0.5 /100 | #273 | Tragic 3.6% |
| Potawatomi | 0.5 /100 | #274 | Tragic 3.6% |
| Immigrants | Dominica | 0.5 /100 | #275 | Tragic 3.6% |
| Liberians | 0.5 /100 | #276 | Tragic 3.6% |
| Cheyenne | 0.5 /100 | #277 | Tragic 3.6% |
| Japanese | 0.5 /100 | #278 | Tragic 3.5% |
| Immigrants | Portugal | 0.5 /100 | #279 | Tragic 3.5% |
| Dominicans | 0.5 /100 | #280 | Tragic 3.5% |
| Apache | 0.5 /100 | #281 | Tragic 3.5% |
| Immigrants | Caribbean | 0.5 /100 | #282 | Tragic 3.5% |