Kenyan vs Immigrants from Zaire Poverty
COMPARE
Kenyan
Immigrants from Zaire
Poverty
Poverty Comparison
Kenyans
Immigrants from Zaire
12.5%
POVERTY
38.8/ 100
METRIC RATING
184th/ 347
METRIC RANK
15.1%
POVERTY
0.0/ 100
METRIC RATING
293rd/ 347
METRIC RANK
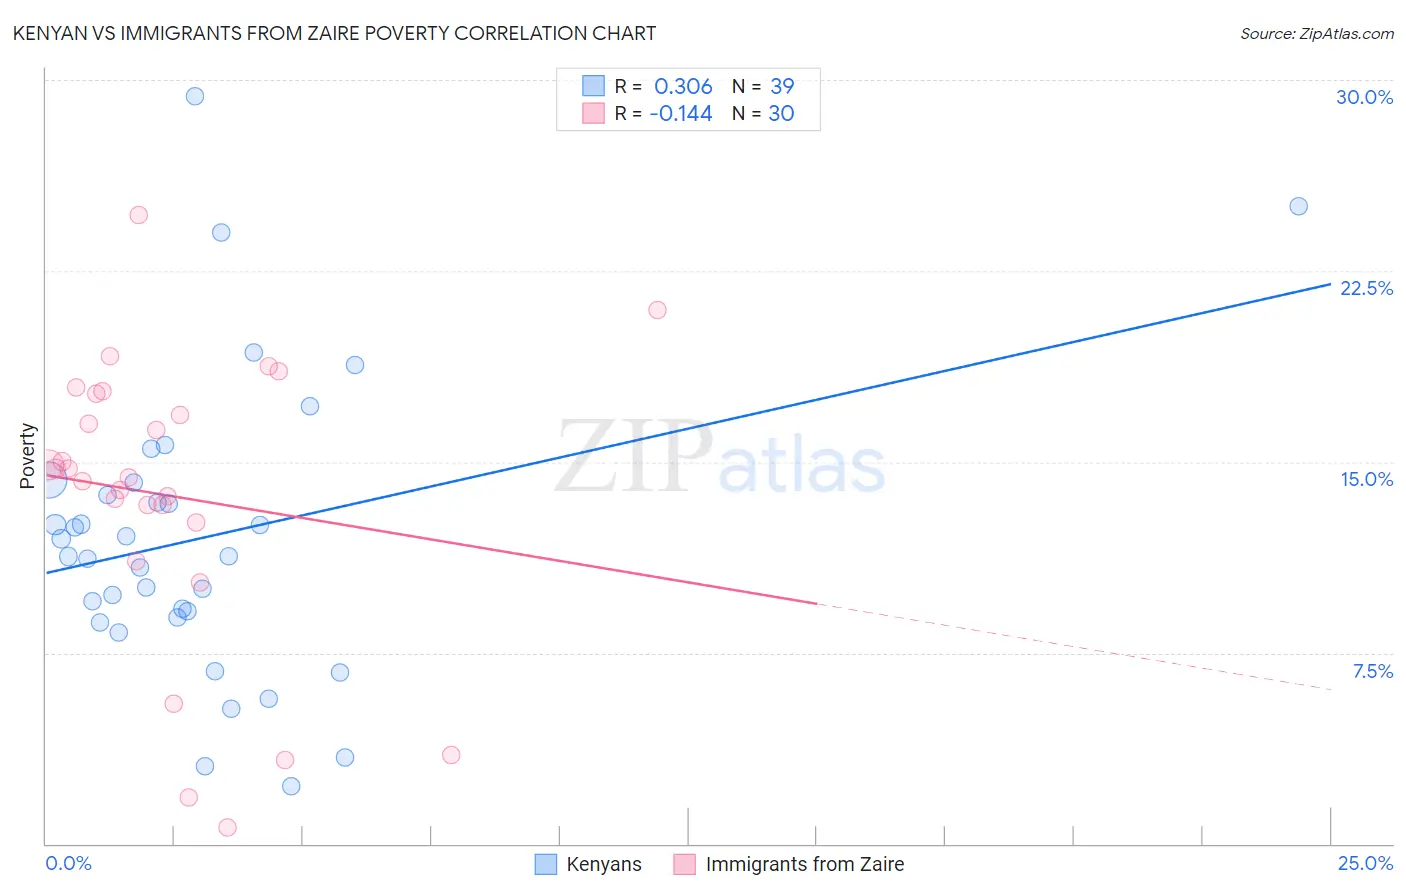
Kenyan vs Immigrants from Zaire Poverty Correlation Chart
The statistical analysis conducted on geographies consisting of 168,174,579 people shows a mild positive correlation between the proportion of Kenyans and poverty level in the United States with a correlation coefficient (R) of 0.306 and weighted average of 12.5%. Similarly, the statistical analysis conducted on geographies consisting of 107,241,785 people shows a poor negative correlation between the proportion of Immigrants from Zaire and poverty level in the United States with a correlation coefficient (R) of -0.144 and weighted average of 15.1%, a difference of 21.5%.
Poverty Correlation Summary
| Measurement | Kenyan | Immigrants from Zaire |
| Minimum | 2.2% | 0.62% |
| Maximum | 29.3% | 24.7% |
| Range | 27.1% | 24.1% |
| Mean | 12.0% | 13.7% |
| Median | 11.3% | 14.6% |
| Interquartile 25% (IQ1) | 8.9% | 12.6% |
| Interquartile 75% (IQ3) | 14.2% | 17.7% |
| Interquartile Range (IQR) | 5.3% | 5.1% |
| Standard Deviation (Sample) | 5.7% | 5.7% |
| Standard Deviation (Population) | 5.7% | 5.6% |
Similar Demographics by Poverty
Demographics Similar to Kenyans by Poverty
In terms of poverty, the demographic groups most similar to Kenyans are Immigrants from Iraq (12.4%, a difference of 0.13%), Israeli (12.5%, a difference of 0.24%), Immigrants from Sierra Leone (12.5%, a difference of 0.26%), Immigrants from Cameroon (12.4%, a difference of 0.29%), and Immigrants from Afghanistan (12.4%, a difference of 0.33%).
| Demographics | Rating | Rank | Poverty |
| Immigrants | Syria | 47.5 /100 | #177 | Average 12.3% |
| Uruguayans | 44.7 /100 | #178 | Average 12.4% |
| Immigrants | Morocco | 44.0 /100 | #179 | Average 12.4% |
| Mongolians | 43.6 /100 | #180 | Average 12.4% |
| Immigrants | Afghanistan | 42.1 /100 | #181 | Average 12.4% |
| Immigrants | Cameroon | 41.7 /100 | #182 | Average 12.4% |
| Immigrants | Iraq | 40.2 /100 | #183 | Average 12.4% |
| Kenyans | 38.8 /100 | #184 | Fair 12.5% |
| Israelis | 36.4 /100 | #185 | Fair 12.5% |
| Immigrants | Sierra Leone | 36.3 /100 | #186 | Fair 12.5% |
| Hawaiians | 34.1 /100 | #187 | Fair 12.5% |
| Immigrants | Costa Rica | 33.3 /100 | #188 | Fair 12.5% |
| Aleuts | 33.2 /100 | #189 | Fair 12.5% |
| Immigrants | South America | 32.3 /100 | #190 | Fair 12.5% |
| Sierra Leoneans | 31.5 /100 | #191 | Fair 12.6% |
Demographics Similar to Immigrants from Zaire by Poverty
In terms of poverty, the demographic groups most similar to Immigrants from Zaire are Indonesian (15.1%, a difference of 0.010%), Immigrants from Cabo Verde (15.1%, a difference of 0.060%), Mexican (15.1%, a difference of 0.18%), Immigrants from Belize (15.1%, a difference of 0.29%), and Yaqui (15.1%, a difference of 0.40%).
| Demographics | Rating | Rank | Poverty |
| Immigrants | Latin America | 0.0 /100 | #286 | Tragic 15.0% |
| Inupiat | 0.0 /100 | #287 | Tragic 15.1% |
| Yaqui | 0.0 /100 | #288 | Tragic 15.1% |
| Immigrants | Belize | 0.0 /100 | #289 | Tragic 15.1% |
| Mexicans | 0.0 /100 | #290 | Tragic 15.1% |
| Immigrants | Cabo Verde | 0.0 /100 | #291 | Tragic 15.1% |
| Indonesians | 0.0 /100 | #292 | Tragic 15.1% |
| Immigrants | Zaire | 0.0 /100 | #293 | Tragic 15.1% |
| Blackfeet | 0.0 /100 | #294 | Tragic 15.2% |
| Guatemalans | 0.0 /100 | #295 | Tragic 15.3% |
| Hispanics or Latinos | 0.0 /100 | #296 | Tragic 15.3% |
| Immigrants | Bangladesh | 0.0 /100 | #297 | Tragic 15.3% |
| Immigrants | Senegal | 0.0 /100 | #298 | Tragic 15.3% |
| Senegalese | 0.0 /100 | #299 | Tragic 15.3% |
| Immigrants | Central America | 0.0 /100 | #300 | Tragic 15.4% |