Kenyan vs Syrian Family Poverty
COMPARE
Kenyan
Syrian
Family Poverty
Family Poverty Comparison
Kenyans
Syrians
8.9%
FAMILY POVERTY
58.2/ 100
METRIC RATING
170th/ 347
METRIC RANK
8.6%
FAMILY POVERTY
80.3/ 100
METRIC RATING
150th/ 347
METRIC RANK
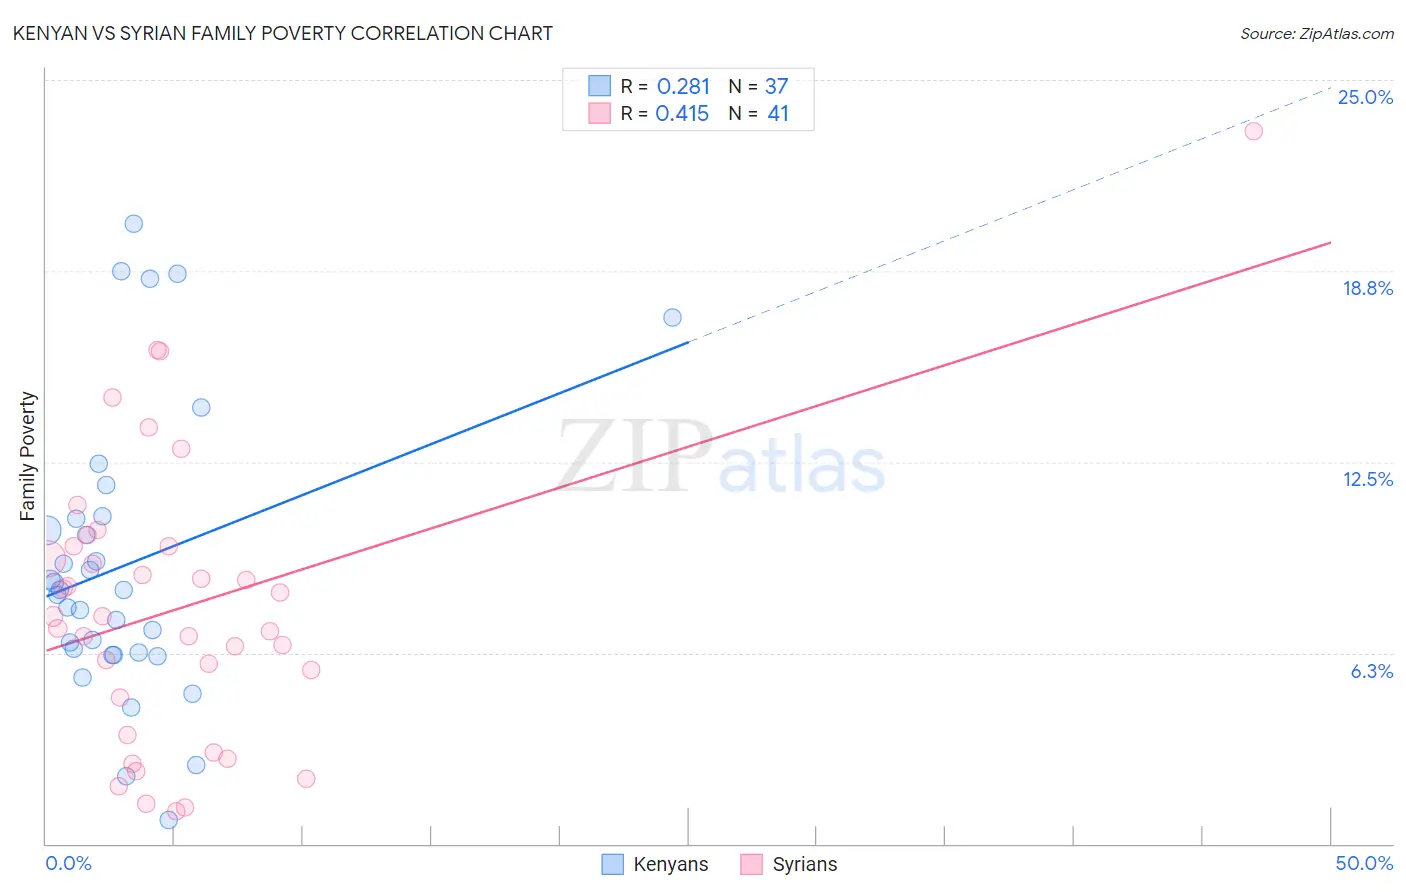
Kenyan vs Syrian Family Poverty Correlation Chart
The statistical analysis conducted on geographies consisting of 168,038,695 people shows a weak positive correlation between the proportion of Kenyans and poverty level among families in the United States with a correlation coefficient (R) of 0.281 and weighted average of 8.9%. Similarly, the statistical analysis conducted on geographies consisting of 265,791,569 people shows a moderate positive correlation between the proportion of Syrians and poverty level among families in the United States with a correlation coefficient (R) of 0.415 and weighted average of 8.6%, a difference of 3.7%.
Family Poverty Correlation Summary
| Measurement | Kenyan | Syrian |
| Minimum | 0.77% | 1.1% |
| Maximum | 20.3% | 23.3% |
| Range | 19.5% | 22.3% |
| Mean | 9.1% | 7.7% |
| Median | 8.3% | 7.4% |
| Interquartile 25% (IQ1) | 6.2% | 4.2% |
| Interquartile 75% (IQ3) | 10.7% | 9.7% |
| Interquartile Range (IQR) | 4.5% | 5.6% |
| Standard Deviation (Sample) | 4.7% | 4.7% |
| Standard Deviation (Population) | 4.6% | 4.6% |
Demographics Similar to Kenyans and Syrians by Family Poverty
In terms of family poverty, the demographic groups most similar to Kenyans are Immigrants from Chile (8.9%, a difference of 0.19%), Israeli (8.9%, a difference of 0.54%), Immigrants from Ethiopia (8.9%, a difference of 0.60%), Afghan (8.8%, a difference of 0.74%), and Guamanian/Chamorro (8.8%, a difference of 0.92%). Similarly, the demographic groups most similar to Syrians are Brazilian (8.6%, a difference of 0.050%), Samoan (8.6%, a difference of 0.13%), Immigrants from Spain (8.6%, a difference of 0.26%), Immigrants from Vietnam (8.7%, a difference of 0.98%), and Immigrants from Kuwait (8.7%, a difference of 1.3%).
| Demographics | Rating | Rank | Family Poverty |
| Syrians | 80.3 /100 | #150 | Excellent 8.6% |
| Brazilians | 80.1 /100 | #151 | Excellent 8.6% |
| Samoans | 79.8 /100 | #152 | Good 8.6% |
| Immigrants | Spain | 79.1 /100 | #153 | Good 8.6% |
| Immigrants | Vietnam | 75.4 /100 | #154 | Good 8.7% |
| Immigrants | Kuwait | 73.6 /100 | #155 | Good 8.7% |
| Immigrants | Oceania | 71.2 /100 | #156 | Good 8.7% |
| Tsimshian | 69.3 /100 | #157 | Good 8.8% |
| Whites/Caucasians | 69.1 /100 | #158 | Good 8.8% |
| Peruvians | 68.0 /100 | #159 | Good 8.8% |
| Hungarians | 67.2 /100 | #160 | Good 8.8% |
| Immigrants | Northern Africa | 66.9 /100 | #161 | Good 8.8% |
| Ethiopians | 66.3 /100 | #162 | Good 8.8% |
| Pennsylvania Germans | 66.0 /100 | #163 | Good 8.8% |
| Celtics | 64.9 /100 | #164 | Good 8.8% |
| Guamanians/Chamorros | 64.7 /100 | #165 | Good 8.8% |
| Afghans | 63.5 /100 | #166 | Good 8.8% |
| Immigrants | Ethiopia | 62.5 /100 | #167 | Good 8.9% |
| Israelis | 62.1 /100 | #168 | Good 8.9% |
| Immigrants | Chile | 59.6 /100 | #169 | Average 8.9% |
| Kenyans | 58.2 /100 | #170 | Average 8.9% |