Kenyan vs Immigrants from Dominica Family Poverty
COMPARE
Kenyan
Immigrants from Dominica
Family Poverty
Family Poverty Comparison
Kenyans
Immigrants from Dominica
8.9%
FAMILY POVERTY
58.2/ 100
METRIC RATING
170th/ 347
METRIC RANK
12.7%
FAMILY POVERTY
0.0/ 100
METRIC RATING
324th/ 347
METRIC RANK
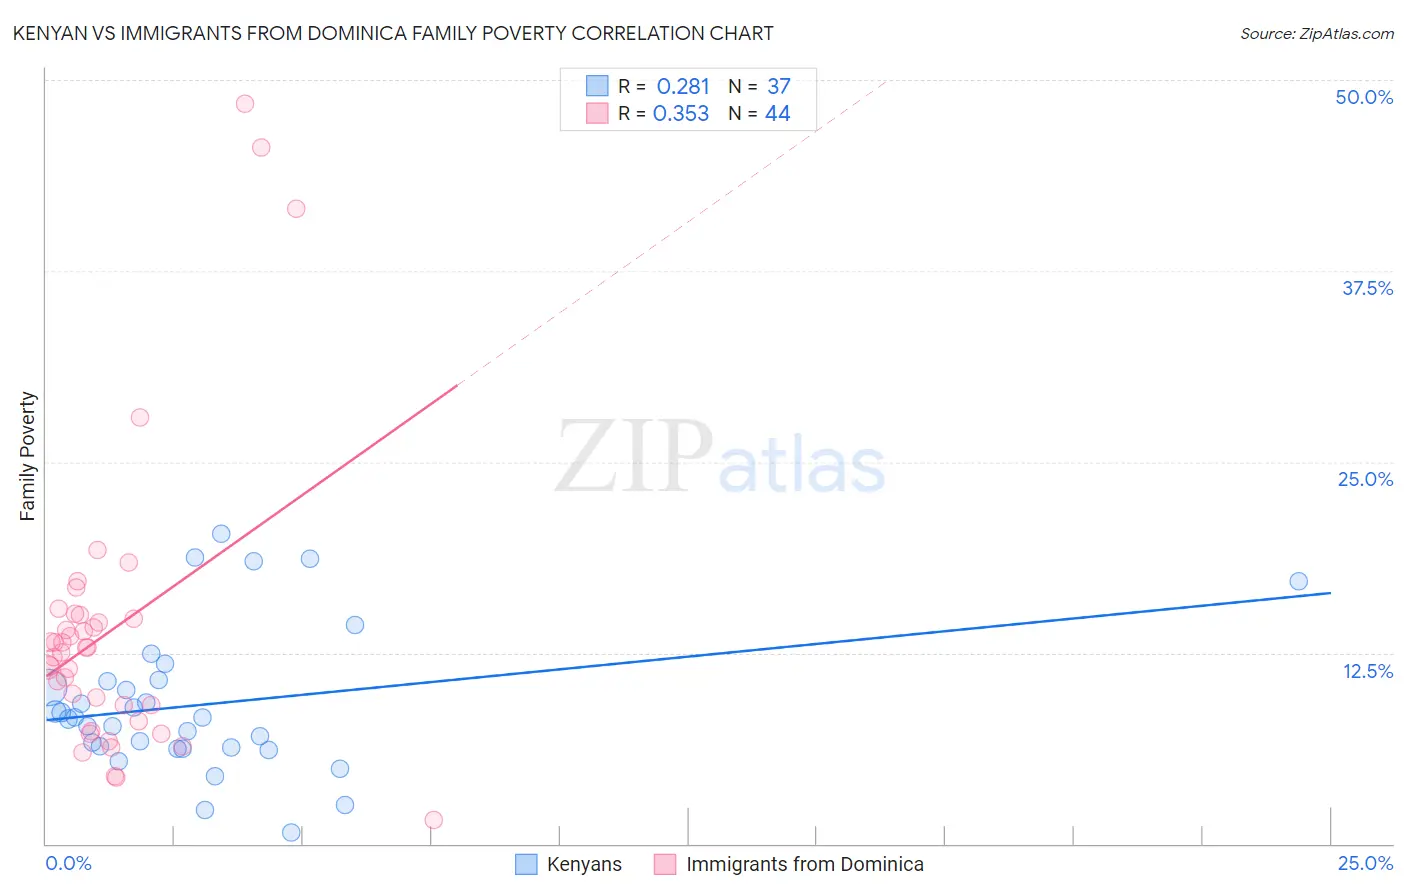
Kenyan vs Immigrants from Dominica Family Poverty Correlation Chart
The statistical analysis conducted on geographies consisting of 168,038,695 people shows a weak positive correlation between the proportion of Kenyans and poverty level among families in the United States with a correlation coefficient (R) of 0.281 and weighted average of 8.9%. Similarly, the statistical analysis conducted on geographies consisting of 83,762,031 people shows a mild positive correlation between the proportion of Immigrants from Dominica and poverty level among families in the United States with a correlation coefficient (R) of 0.353 and weighted average of 12.7%, a difference of 43.0%.
Family Poverty Correlation Summary
| Measurement | Kenyan | Immigrants from Dominica |
| Minimum | 0.77% | 1.5% |
| Maximum | 20.3% | 48.5% |
| Range | 19.5% | 47.0% |
| Mean | 9.1% | 14.0% |
| Median | 8.3% | 12.7% |
| Interquartile 25% (IQ1) | 6.2% | 8.5% |
| Interquartile 75% (IQ3) | 10.7% | 14.9% |
| Interquartile Range (IQR) | 4.5% | 6.3% |
| Standard Deviation (Sample) | 4.7% | 9.8% |
| Standard Deviation (Population) | 4.6% | 9.6% |
Similar Demographics by Family Poverty
Demographics Similar to Kenyans by Family Poverty
In terms of family poverty, the demographic groups most similar to Kenyans are Lebanese (8.9%, a difference of 0.080%), Immigrants from Peru (8.9%, a difference of 0.090%), Immigrants from Chile (8.9%, a difference of 0.19%), Immigrants from Fiji (8.9%, a difference of 0.25%), and Israeli (8.9%, a difference of 0.54%).
| Demographics | Rating | Rank | Family Poverty |
| Pennsylvania Germans | 66.0 /100 | #163 | Good 8.8% |
| Celtics | 64.9 /100 | #164 | Good 8.8% |
| Guamanians/Chamorros | 64.7 /100 | #165 | Good 8.8% |
| Afghans | 63.5 /100 | #166 | Good 8.8% |
| Immigrants | Ethiopia | 62.5 /100 | #167 | Good 8.9% |
| Israelis | 62.1 /100 | #168 | Good 8.9% |
| Immigrants | Chile | 59.6 /100 | #169 | Average 8.9% |
| Kenyans | 58.2 /100 | #170 | Average 8.9% |
| Lebanese | 57.6 /100 | #171 | Average 8.9% |
| Immigrants | Peru | 57.5 /100 | #172 | Average 8.9% |
| Immigrants | Fiji | 56.4 /100 | #173 | Average 8.9% |
| Immigrants | Albania | 50.0 /100 | #174 | Average 9.0% |
| Costa Ricans | 49.3 /100 | #175 | Average 9.0% |
| Immigrants | Syria | 47.5 /100 | #176 | Average 9.0% |
| Hawaiians | 47.2 /100 | #177 | Average 9.0% |
Demographics Similar to Immigrants from Dominica by Family Poverty
In terms of family poverty, the demographic groups most similar to Immigrants from Dominica are Menominee (12.7%, a difference of 0.080%), Immigrants from Honduras (12.7%, a difference of 0.62%), Arapaho (12.7%, a difference of 0.72%), Paiute (13.0%, a difference of 2.0%), and Colville (13.0%, a difference of 2.0%).
| Demographics | Rating | Rank | Family Poverty |
| Immigrants | Grenada | 0.0 /100 | #317 | Tragic 12.4% |
| U.S. Virgin Islanders | 0.0 /100 | #318 | Tragic 12.4% |
| British West Indians | 0.0 /100 | #319 | Tragic 12.4% |
| Inupiat | 0.0 /100 | #320 | Tragic 12.5% |
| Arapaho | 0.0 /100 | #321 | Tragic 12.7% |
| Immigrants | Honduras | 0.0 /100 | #322 | Tragic 12.7% |
| Menominee | 0.0 /100 | #323 | Tragic 12.7% |
| Immigrants | Dominica | 0.0 /100 | #324 | Tragic 12.7% |
| Paiute | 0.0 /100 | #325 | Tragic 13.0% |
| Colville | 0.0 /100 | #326 | Tragic 13.0% |
| Yakama | 0.0 /100 | #327 | Tragic 13.1% |
| Central American Indians | 0.0 /100 | #328 | Tragic 13.3% |
| Blacks/African Americans | 0.0 /100 | #329 | Tragic 13.3% |
| Natives/Alaskans | 0.0 /100 | #330 | Tragic 14.3% |
| Cheyenne | 0.0 /100 | #331 | Tragic 14.3% |