Kenyan vs Slovene Family Poverty
COMPARE
Kenyan
Slovene
Family Poverty
Family Poverty Comparison
Kenyans
Slovenes
8.9%
FAMILY POVERTY
58.2/ 100
METRIC RATING
170th/ 347
METRIC RANK
7.5%
FAMILY POVERTY
99.3/ 100
METRIC RATING
40th/ 347
METRIC RANK
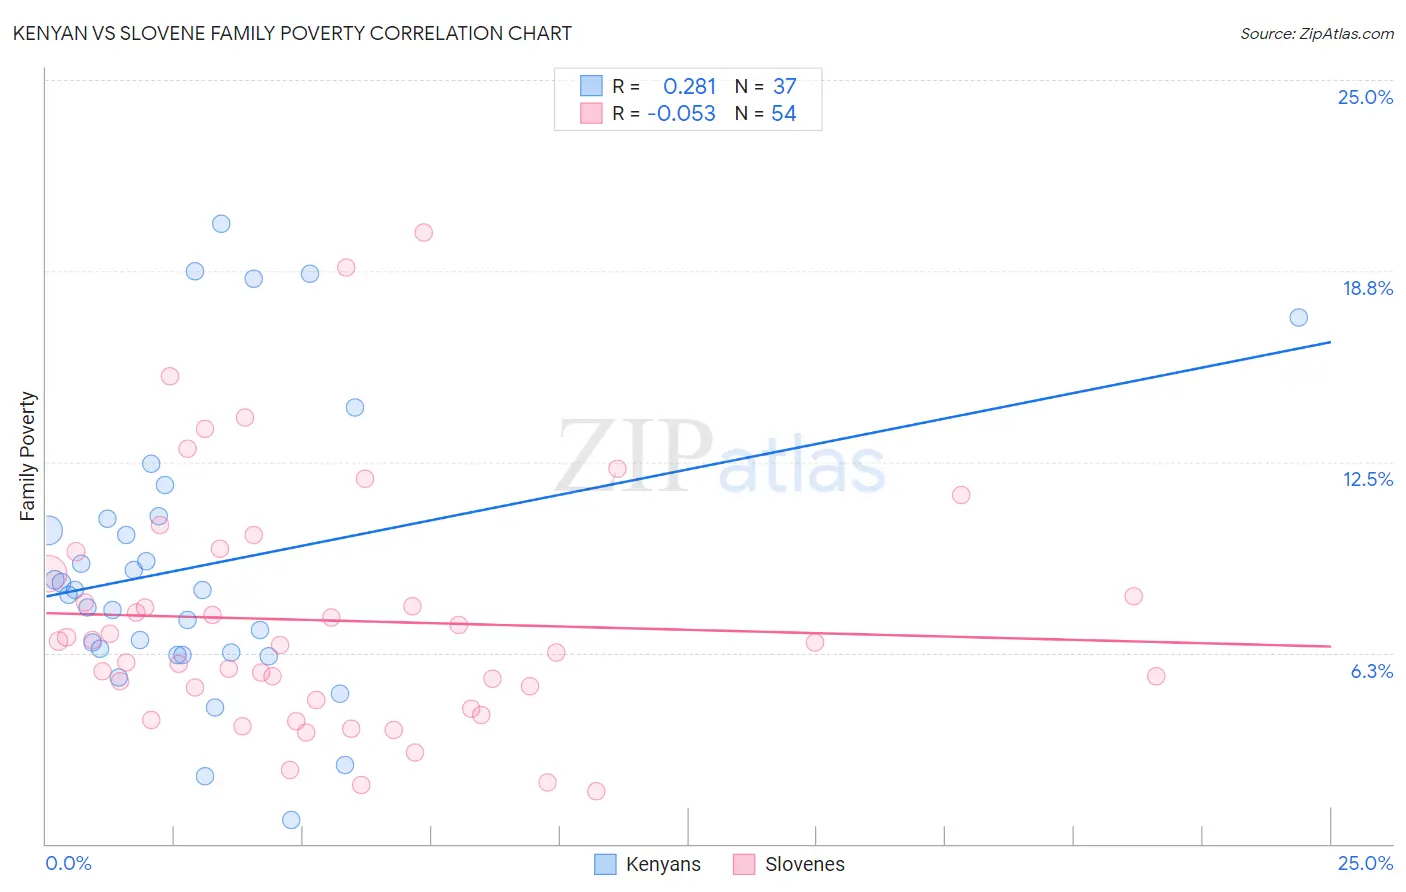
Kenyan vs Slovene Family Poverty Correlation Chart
The statistical analysis conducted on geographies consisting of 168,038,695 people shows a weak positive correlation between the proportion of Kenyans and poverty level among families in the United States with a correlation coefficient (R) of 0.281 and weighted average of 8.9%. Similarly, the statistical analysis conducted on geographies consisting of 260,812,664 people shows a slight negative correlation between the proportion of Slovenes and poverty level among families in the United States with a correlation coefficient (R) of -0.053 and weighted average of 7.5%, a difference of 18.0%.
Family Poverty Correlation Summary
| Measurement | Kenyan | Slovene |
| Minimum | 0.77% | 1.7% |
| Maximum | 20.3% | 20.0% |
| Range | 19.5% | 18.3% |
| Mean | 9.1% | 7.3% |
| Median | 8.3% | 6.6% |
| Interquartile 25% (IQ1) | 6.2% | 4.7% |
| Interquartile 75% (IQ3) | 10.7% | 8.8% |
| Interquartile Range (IQR) | 4.5% | 4.1% |
| Standard Deviation (Sample) | 4.7% | 4.0% |
| Standard Deviation (Population) | 4.6% | 3.9% |
Similar Demographics by Family Poverty
Demographics Similar to Kenyans by Family Poverty
In terms of family poverty, the demographic groups most similar to Kenyans are Lebanese (8.9%, a difference of 0.080%), Immigrants from Peru (8.9%, a difference of 0.090%), Immigrants from Chile (8.9%, a difference of 0.19%), Immigrants from Fiji (8.9%, a difference of 0.25%), and Israeli (8.9%, a difference of 0.54%).
| Demographics | Rating | Rank | Family Poverty |
| Pennsylvania Germans | 66.0 /100 | #163 | Good 8.8% |
| Celtics | 64.9 /100 | #164 | Good 8.8% |
| Guamanians/Chamorros | 64.7 /100 | #165 | Good 8.8% |
| Afghans | 63.5 /100 | #166 | Good 8.8% |
| Immigrants | Ethiopia | 62.5 /100 | #167 | Good 8.9% |
| Israelis | 62.1 /100 | #168 | Good 8.9% |
| Immigrants | Chile | 59.6 /100 | #169 | Average 8.9% |
| Kenyans | 58.2 /100 | #170 | Average 8.9% |
| Lebanese | 57.6 /100 | #171 | Average 8.9% |
| Immigrants | Peru | 57.5 /100 | #172 | Average 8.9% |
| Immigrants | Fiji | 56.4 /100 | #173 | Average 8.9% |
| Immigrants | Albania | 50.0 /100 | #174 | Average 9.0% |
| Costa Ricans | 49.3 /100 | #175 | Average 9.0% |
| Immigrants | Syria | 47.5 /100 | #176 | Average 9.0% |
| Hawaiians | 47.2 /100 | #177 | Average 9.0% |
Demographics Similar to Slovenes by Family Poverty
In terms of family poverty, the demographic groups most similar to Slovenes are Carpatho Rusyn (7.5%, a difference of 0.040%), Bolivian (7.5%, a difference of 0.10%), Immigrants from Australia (7.6%, a difference of 0.30%), Estonian (7.5%, a difference of 0.34%), and Turkish (7.5%, a difference of 0.51%).
| Demographics | Rating | Rank | Family Poverty |
| Immigrants | Japan | 99.5 /100 | #33 | Exceptional 7.4% |
| Russians | 99.5 /100 | #34 | Exceptional 7.5% |
| Greeks | 99.4 /100 | #35 | Exceptional 7.5% |
| Turks | 99.4 /100 | #36 | Exceptional 7.5% |
| Estonians | 99.4 /100 | #37 | Exceptional 7.5% |
| Bolivians | 99.3 /100 | #38 | Exceptional 7.5% |
| Carpatho Rusyns | 99.3 /100 | #39 | Exceptional 7.5% |
| Slovenes | 99.3 /100 | #40 | Exceptional 7.5% |
| Immigrants | Australia | 99.2 /100 | #41 | Exceptional 7.6% |
| Scandinavians | 99.1 /100 | #42 | Exceptional 7.6% |
| Immigrants | Austria | 99.1 /100 | #43 | Exceptional 7.6% |
| Germans | 99.0 /100 | #44 | Exceptional 7.7% |
| Okinawans | 98.9 /100 | #45 | Exceptional 7.7% |
| Tongans | 98.9 /100 | #46 | Exceptional 7.7% |
| Immigrants | Czechoslovakia | 98.9 /100 | #47 | Exceptional 7.7% |