Kenyan vs Lumbee Family Poverty
COMPARE
Kenyan
Lumbee
Family Poverty
Family Poverty Comparison
Kenyans
Lumbee
8.9%
FAMILY POVERTY
58.2/ 100
METRIC RATING
170th/ 347
METRIC RANK
17.0%
FAMILY POVERTY
0.0/ 100
METRIC RATING
341st/ 347
METRIC RANK
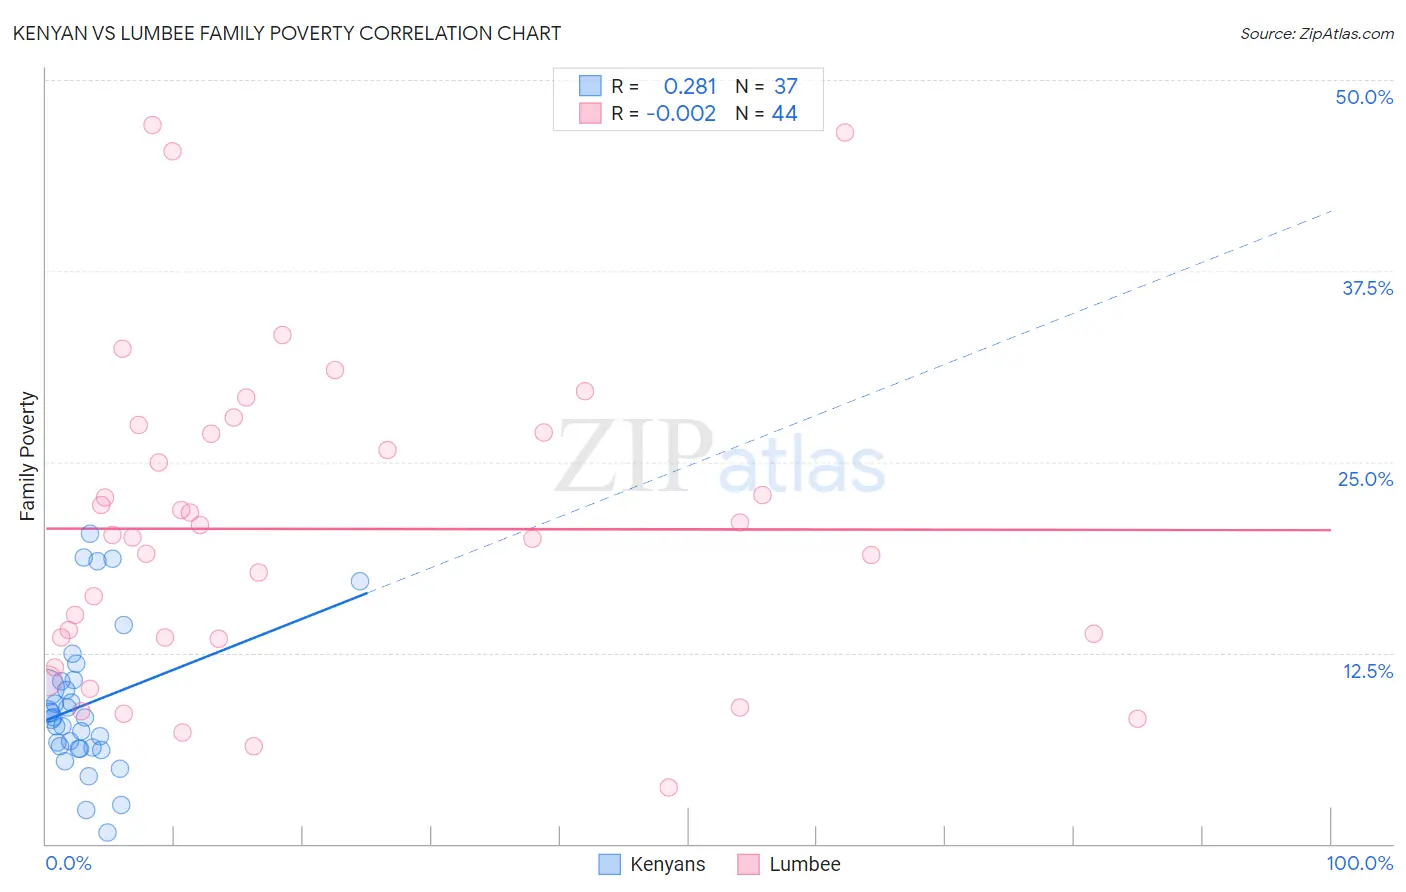
Kenyan vs Lumbee Family Poverty Correlation Chart
The statistical analysis conducted on geographies consisting of 168,038,695 people shows a weak positive correlation between the proportion of Kenyans and poverty level among families in the United States with a correlation coefficient (R) of 0.281 and weighted average of 8.9%. Similarly, the statistical analysis conducted on geographies consisting of 92,238,507 people shows no correlation between the proportion of Lumbee and poverty level among families in the United States with a correlation coefficient (R) of -0.002 and weighted average of 17.0%, a difference of 90.8%.
Family Poverty Correlation Summary
| Measurement | Kenyan | Lumbee |
| Minimum | 0.77% | 3.7% |
| Maximum | 20.3% | 47.0% |
| Range | 19.5% | 43.3% |
| Mean | 9.1% | 20.6% |
| Median | 8.3% | 20.2% |
| Interquartile 25% (IQ1) | 6.2% | 13.5% |
| Interquartile 75% (IQ3) | 10.7% | 26.9% |
| Interquartile Range (IQR) | 4.5% | 13.4% |
| Standard Deviation (Sample) | 4.7% | 10.4% |
| Standard Deviation (Population) | 4.6% | 10.3% |
Similar Demographics by Family Poverty
Demographics Similar to Kenyans by Family Poverty
In terms of family poverty, the demographic groups most similar to Kenyans are Lebanese (8.9%, a difference of 0.080%), Immigrants from Peru (8.9%, a difference of 0.090%), Immigrants from Chile (8.9%, a difference of 0.19%), Immigrants from Fiji (8.9%, a difference of 0.25%), and Israeli (8.9%, a difference of 0.54%).
| Demographics | Rating | Rank | Family Poverty |
| Pennsylvania Germans | 66.0 /100 | #163 | Good 8.8% |
| Celtics | 64.9 /100 | #164 | Good 8.8% |
| Guamanians/Chamorros | 64.7 /100 | #165 | Good 8.8% |
| Afghans | 63.5 /100 | #166 | Good 8.8% |
| Immigrants | Ethiopia | 62.5 /100 | #167 | Good 8.9% |
| Israelis | 62.1 /100 | #168 | Good 8.9% |
| Immigrants | Chile | 59.6 /100 | #169 | Average 8.9% |
| Kenyans | 58.2 /100 | #170 | Average 8.9% |
| Lebanese | 57.6 /100 | #171 | Average 8.9% |
| Immigrants | Peru | 57.5 /100 | #172 | Average 8.9% |
| Immigrants | Fiji | 56.4 /100 | #173 | Average 8.9% |
| Immigrants | Albania | 50.0 /100 | #174 | Average 9.0% |
| Costa Ricans | 49.3 /100 | #175 | Average 9.0% |
| Immigrants | Syria | 47.5 /100 | #176 | Average 9.0% |
| Hawaiians | 47.2 /100 | #177 | Average 9.0% |
Demographics Similar to Lumbee by Family Poverty
In terms of family poverty, the demographic groups most similar to Lumbee are Pueblo (17.0%, a difference of 0.070%), Yuman (16.6%, a difference of 2.1%), Immigrants from Yemen (17.5%, a difference of 2.8%), Crow (16.1%, a difference of 5.5%), and Hopi (15.9%, a difference of 6.7%).
| Demographics | Rating | Rank | Family Poverty |
| Immigrants | Dominican Republic | 0.0 /100 | #333 | Tragic 14.4% |
| Houma | 0.0 /100 | #334 | Tragic 14.6% |
| Apache | 0.0 /100 | #335 | Tragic 14.7% |
| Sioux | 0.0 /100 | #336 | Tragic 15.9% |
| Hopi | 0.0 /100 | #337 | Tragic 15.9% |
| Crow | 0.0 /100 | #338 | Tragic 16.1% |
| Yuman | 0.0 /100 | #339 | Tragic 16.6% |
| Pueblo | 0.0 /100 | #340 | Tragic 17.0% |
| Lumbee | 0.0 /100 | #341 | Tragic 17.0% |
| Immigrants | Yemen | 0.0 /100 | #342 | Tragic 17.5% |
| Pima | 0.0 /100 | #343 | Tragic 18.4% |
| Yup'ik | 0.0 /100 | #344 | Tragic 18.7% |
| Navajo | 0.0 /100 | #345 | Tragic 18.8% |
| Puerto Ricans | 0.0 /100 | #346 | Tragic 20.3% |
| Tohono O'odham | 0.0 /100 | #347 | Tragic 20.4% |