Japanese vs Apache Average Family Size
COMPARE
Japanese
Apache
Average Family Size
Average Family Size Comparison
Japanese
Apache
3.35
AVERAGE FAMILY SIZE
100.0/ 100
METRIC RATING
59th/ 347
METRIC RANK
3.46
AVERAGE FAMILY SIZE
100.0/ 100
METRIC RATING
22nd/ 347
METRIC RANK
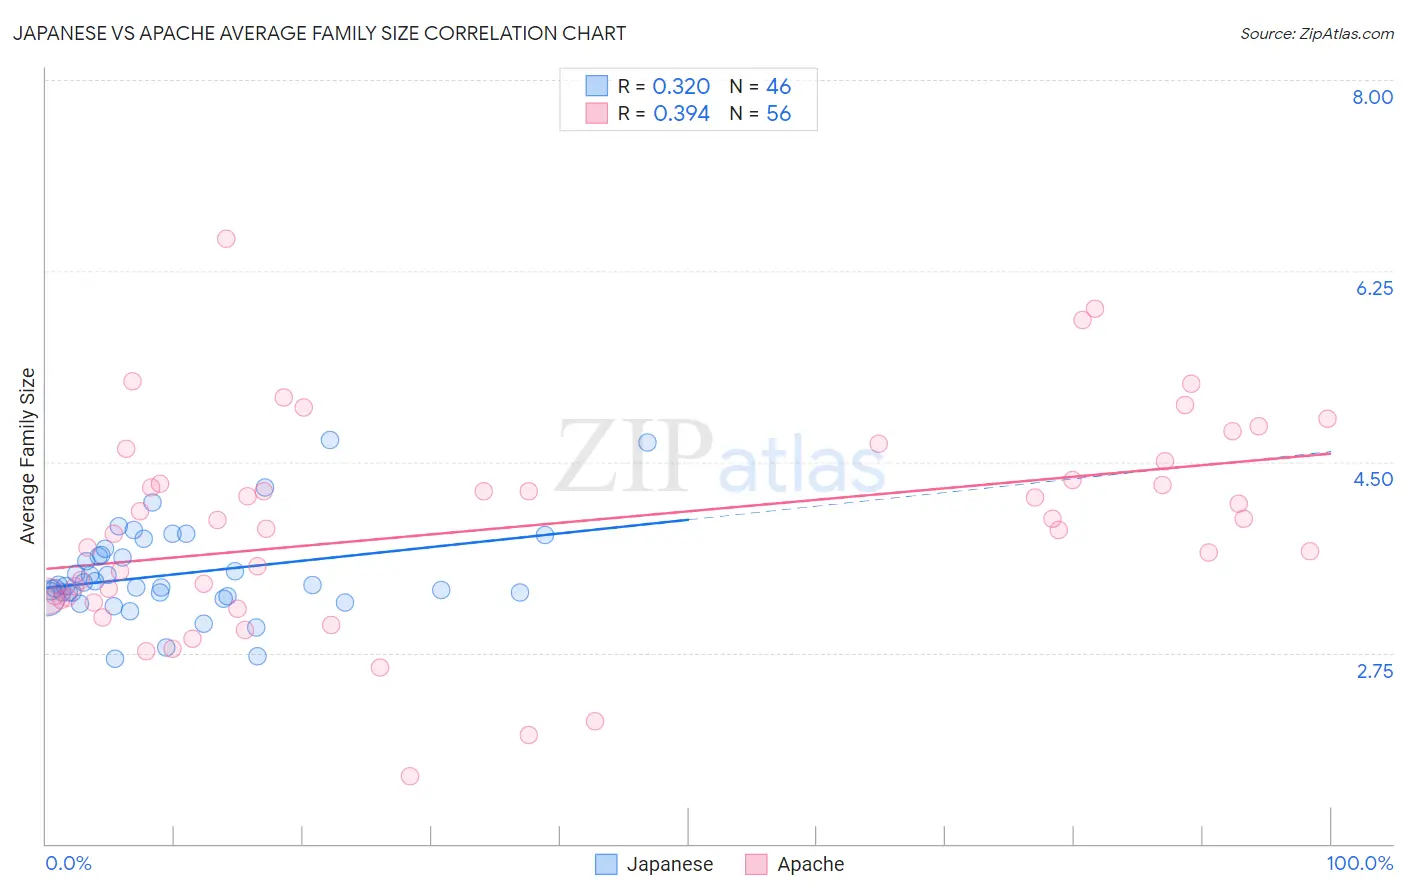
Japanese vs Apache Average Family Size Correlation Chart
The statistical analysis conducted on geographies consisting of 249,073,483 people shows a mild positive correlation between the proportion of Japanese and average family size in the United States with a correlation coefficient (R) of 0.320 and weighted average of 3.35. Similarly, the statistical analysis conducted on geographies consisting of 231,040,944 people shows a mild positive correlation between the proportion of Apache and average family size in the United States with a correlation coefficient (R) of 0.394 and weighted average of 3.46, a difference of 3.4%.
Average Family Size Correlation Summary
| Measurement | Japanese | Apache |
| Minimum | 2.70 | 1.62 |
| Maximum | 4.70 | 6.54 |
| Range | 2.00 | 4.92 |
| Mean | 3.47 | 3.91 |
| Median | 3.37 | 3.93 |
| Interquartile 25% (IQ1) | 3.27 | 3.27 |
| Interquartile 75% (IQ3) | 3.65 | 4.42 |
| Interquartile Range (IQR) | 0.38 | 1.15 |
| Standard Deviation (Sample) | 0.42 | 0.96 |
| Standard Deviation (Population) | 0.41 | 0.96 |
Similar Demographics by Average Family Size
Demographics Similar to Japanese by Average Family Size
In terms of average family size, the demographic groups most similar to Japanese are Immigrants from Armenia (3.35, a difference of 0.020%), Central American Indian (3.35, a difference of 0.050%), Honduran (3.35, a difference of 0.090%), Sri Lankan (3.35, a difference of 0.10%), and Immigrants from Dominican Republic (3.35, a difference of 0.15%).
| Demographics | Rating | Rank | Average Family Size |
| Fijians | 100.0 /100 | #52 | Exceptional 3.36 |
| Koreans | 100.0 /100 | #53 | Exceptional 3.36 |
| Immigrants | South Eastern Asia | 100.0 /100 | #54 | Exceptional 3.36 |
| Immigrants | Honduras | 100.0 /100 | #55 | Exceptional 3.36 |
| Immigrants | Dominican Republic | 100.0 /100 | #56 | Exceptional 3.35 |
| Sri Lankans | 100.0 /100 | #57 | Exceptional 3.35 |
| Hondurans | 100.0 /100 | #58 | Exceptional 3.35 |
| Japanese | 100.0 /100 | #59 | Exceptional 3.35 |
| Immigrants | Armenia | 100.0 /100 | #60 | Exceptional 3.35 |
| Central American Indians | 100.0 /100 | #61 | Exceptional 3.35 |
| Immigrants | Grenada | 100.0 /100 | #62 | Exceptional 3.34 |
| Chinese | 100.0 /100 | #63 | Exceptional 3.34 |
| Dominicans | 99.9 /100 | #64 | Exceptional 3.34 |
| Immigrants | Laos | 99.9 /100 | #65 | Exceptional 3.34 |
| Immigrants | St. Vincent and the Grenadines | 99.9 /100 | #66 | Exceptional 3.34 |
Demographics Similar to Apache by Average Family Size
In terms of average family size, the demographic groups most similar to Apache are Yuman (3.47, a difference of 0.060%), Immigrants from Fiji (3.45, a difference of 0.29%), Cheyenne (3.47, a difference of 0.31%), Mexican (3.48, a difference of 0.35%), and Native/Alaskan (3.45, a difference of 0.41%).
| Demographics | Rating | Rank | Average Family Size |
| Tongans | 100.0 /100 | #15 | Exceptional 3.49 |
| Ute | 100.0 /100 | #16 | Exceptional 3.49 |
| Immigrants | El Salvador | 100.0 /100 | #17 | Exceptional 3.49 |
| Salvadorans | 100.0 /100 | #18 | Exceptional 3.48 |
| Mexicans | 100.0 /100 | #19 | Exceptional 3.48 |
| Cheyenne | 100.0 /100 | #20 | Exceptional 3.47 |
| Yuman | 100.0 /100 | #21 | Exceptional 3.47 |
| Apache | 100.0 /100 | #22 | Exceptional 3.46 |
| Immigrants | Fiji | 100.0 /100 | #23 | Exceptional 3.45 |
| Natives/Alaskans | 100.0 /100 | #24 | Exceptional 3.45 |
| Yakama | 100.0 /100 | #25 | Exceptional 3.45 |
| Native Hawaiians | 100.0 /100 | #26 | Exceptional 3.43 |
| Mexican American Indians | 100.0 /100 | #27 | Exceptional 3.43 |
| Immigrants | Latin America | 100.0 /100 | #28 | Exceptional 3.42 |
| Nepalese | 100.0 /100 | #29 | Exceptional 3.42 |