Japanese vs Eastern European Single Mother Poverty
COMPARE
Japanese
Eastern European
Single Mother Poverty
Single Mother Poverty Comparison
Japanese
Eastern Europeans
28.9%
SINGLE MOTHER POVERTY
68.0/ 100
METRIC RATING
160th/ 347
METRIC RANK
27.2%
SINGLE MOTHER POVERTY
99.6/ 100
METRIC RATING
60th/ 347
METRIC RANK
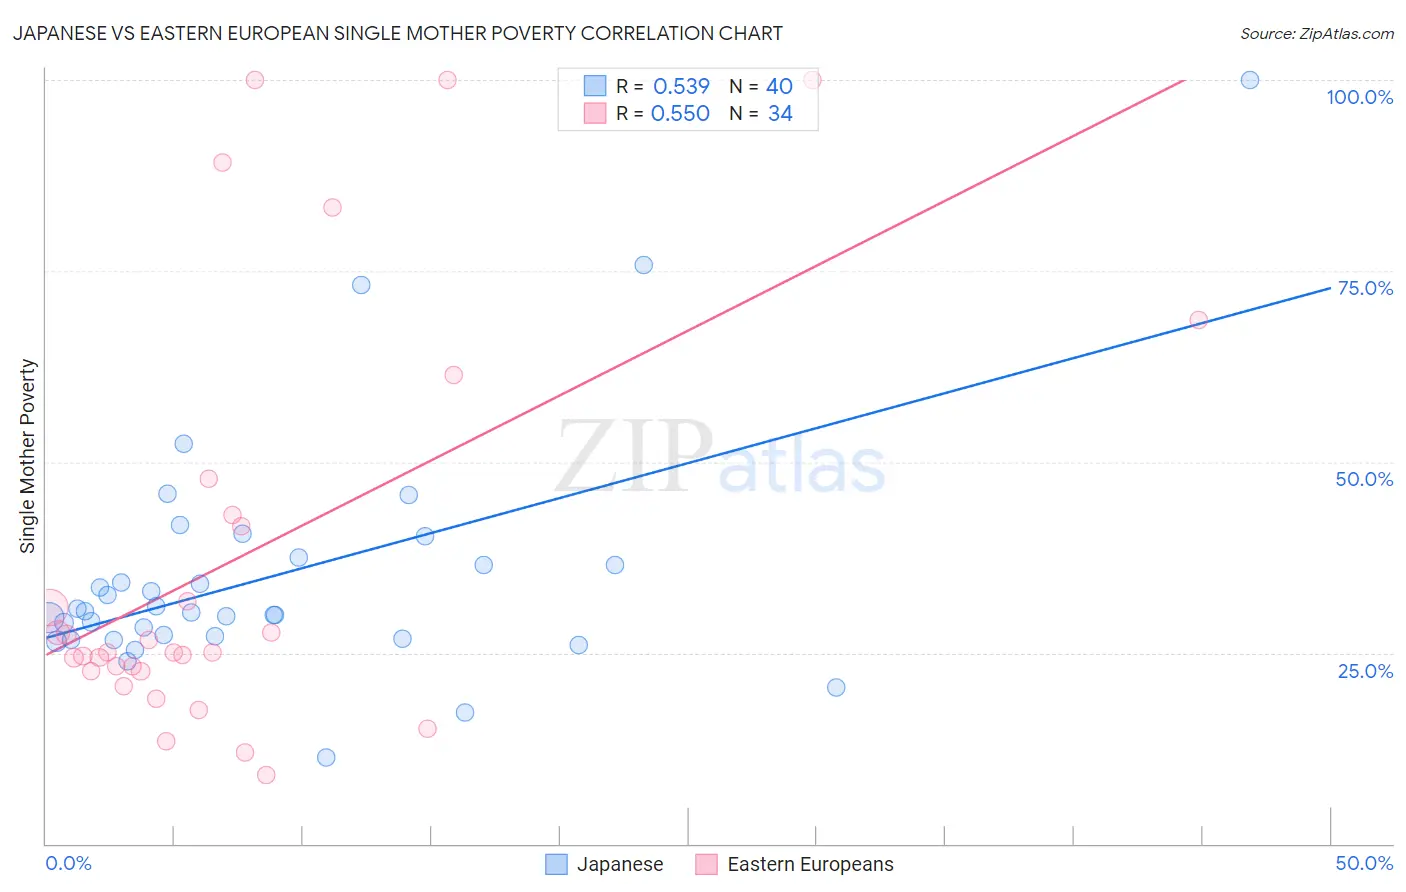
Japanese vs Eastern European Single Mother Poverty Correlation Chart
The statistical analysis conducted on geographies consisting of 246,409,359 people shows a substantial positive correlation between the proportion of Japanese and poverty level among single mothers in the United States with a correlation coefficient (R) of 0.539 and weighted average of 28.9%. Similarly, the statistical analysis conducted on geographies consisting of 444,414,902 people shows a substantial positive correlation between the proportion of Eastern Europeans and poverty level among single mothers in the United States with a correlation coefficient (R) of 0.550 and weighted average of 27.2%, a difference of 6.2%.
Single Mother Poverty Correlation Summary
| Measurement | Japanese | Eastern European |
| Minimum | 11.3% | 9.0% |
| Maximum | 100.0% | 100.0% |
| Range | 88.7% | 91.0% |
| Mean | 35.2% | 37.6% |
| Median | 30.4% | 25.1% |
| Interquartile 25% (IQ1) | 27.0% | 22.7% |
| Interquartile 75% (IQ3) | 37.0% | 43.0% |
| Interquartile Range (IQR) | 10.0% | 20.3% |
| Standard Deviation (Sample) | 16.1% | 27.1% |
| Standard Deviation (Population) | 15.9% | 26.7% |
Similar Demographics by Single Mother Poverty
Demographics Similar to Japanese by Single Mother Poverty
In terms of single mother poverty, the demographic groups most similar to Japanese are Czech (28.9%, a difference of 0.020%), Immigrants from Cambodia (28.9%, a difference of 0.080%), Scandinavian (28.9%, a difference of 0.10%), Immigrants from Nigeria (28.9%, a difference of 0.11%), and Immigrants from Kenya (28.9%, a difference of 0.11%).
| Demographics | Rating | Rank | Single Mother Poverty |
| Slovenes | 76.4 /100 | #153 | Good 28.8% |
| Portuguese | 73.2 /100 | #154 | Good 28.8% |
| Ugandans | 71.7 /100 | #155 | Good 28.8% |
| Iraqis | 71.5 /100 | #156 | Good 28.8% |
| Immigrants | Western Europe | 71.1 /100 | #157 | Good 28.9% |
| Immigrants | Hungary | 70.6 /100 | #158 | Good 28.9% |
| Czechs | 68.4 /100 | #159 | Good 28.9% |
| Japanese | 68.0 /100 | #160 | Good 28.9% |
| Immigrants | Cambodia | 66.6 /100 | #161 | Good 28.9% |
| Scandinavians | 66.2 /100 | #162 | Good 28.9% |
| Immigrants | Nigeria | 65.9 /100 | #163 | Good 28.9% |
| Immigrants | Kenya | 65.9 /100 | #164 | Good 28.9% |
| Arabs | 60.7 /100 | #165 | Good 29.0% |
| Inupiat | 60.4 /100 | #166 | Good 29.0% |
| Costa Ricans | 58.4 /100 | #167 | Average 29.0% |
Demographics Similar to Eastern Europeans by Single Mother Poverty
In terms of single mother poverty, the demographic groups most similar to Eastern Europeans are Paraguayan (27.2%, a difference of 0.040%), Argentinean (27.2%, a difference of 0.050%), Immigrants from Eastern Europe (27.2%, a difference of 0.11%), Palestinian (27.2%, a difference of 0.21%), and Immigrants from Romania (27.2%, a difference of 0.23%).
| Demographics | Rating | Rank | Single Mother Poverty |
| Immigrants | Jordan | 99.7 /100 | #53 | Exceptional 27.1% |
| Immigrants | Bulgaria | 99.7 /100 | #54 | Exceptional 27.1% |
| Immigrants | Egypt | 99.7 /100 | #55 | Exceptional 27.1% |
| Immigrants | Romania | 99.7 /100 | #56 | Exceptional 27.2% |
| Palestinians | 99.7 /100 | #57 | Exceptional 27.2% |
| Argentineans | 99.6 /100 | #58 | Exceptional 27.2% |
| Paraguayans | 99.6 /100 | #59 | Exceptional 27.2% |
| Eastern Europeans | 99.6 /100 | #60 | Exceptional 27.2% |
| Immigrants | Eastern Europe | 99.6 /100 | #61 | Exceptional 27.2% |
| Immigrants | Malaysia | 99.5 /100 | #62 | Exceptional 27.3% |
| Immigrants | Northern Europe | 99.5 /100 | #63 | Exceptional 27.3% |
| Russians | 99.5 /100 | #64 | Exceptional 27.3% |
| Immigrants | Turkey | 99.5 /100 | #65 | Exceptional 27.3% |
| Soviet Union | 99.5 /100 | #66 | Exceptional 27.3% |
| Immigrants | Australia | 99.5 /100 | #67 | Exceptional 27.3% |