Japanese vs Dutch Single Mother Poverty
COMPARE
Japanese
Dutch
Single Mother Poverty
Single Mother Poverty Comparison
Japanese
Dutch
28.9%
SINGLE MOTHER POVERTY
68.0/ 100
METRIC RATING
160th/ 347
METRIC RANK
30.2%
SINGLE MOTHER POVERTY
4.3/ 100
METRIC RATING
231st/ 347
METRIC RANK
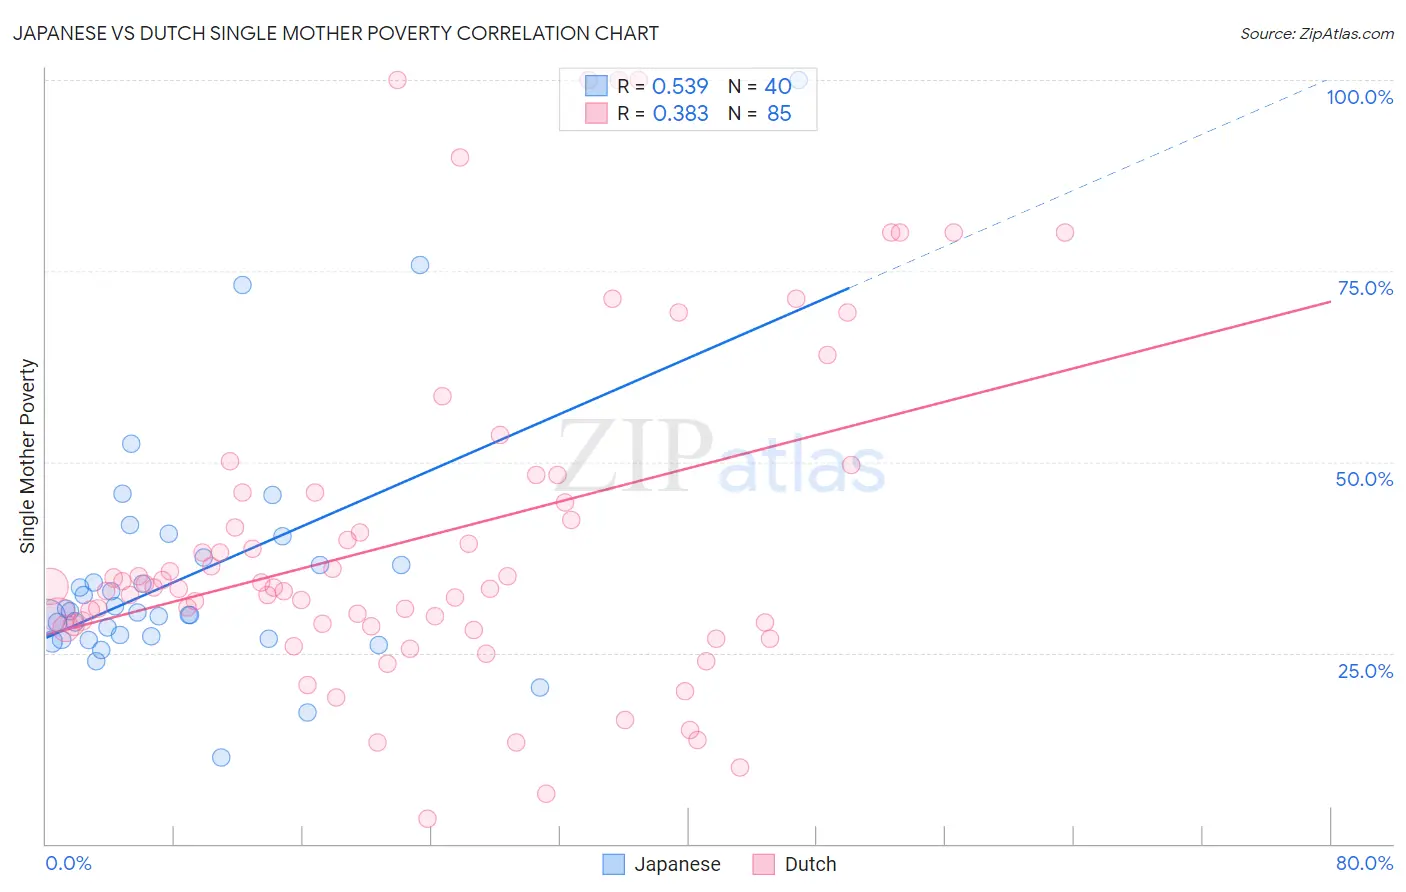
Japanese vs Dutch Single Mother Poverty Correlation Chart
The statistical analysis conducted on geographies consisting of 246,409,359 people shows a substantial positive correlation between the proportion of Japanese and poverty level among single mothers in the United States with a correlation coefficient (R) of 0.539 and weighted average of 28.9%. Similarly, the statistical analysis conducted on geographies consisting of 528,669,117 people shows a mild positive correlation between the proportion of Dutch and poverty level among single mothers in the United States with a correlation coefficient (R) of 0.383 and weighted average of 30.2%, a difference of 4.7%.
Single Mother Poverty Correlation Summary
| Measurement | Japanese | Dutch |
| Minimum | 11.3% | 3.2% |
| Maximum | 100.0% | 100.0% |
| Range | 88.7% | 96.8% |
| Mean | 35.2% | 40.1% |
| Median | 30.4% | 33.5% |
| Interquartile 25% (IQ1) | 27.0% | 28.6% |
| Interquartile 75% (IQ3) | 37.0% | 46.0% |
| Interquartile Range (IQR) | 10.0% | 17.4% |
| Standard Deviation (Sample) | 16.1% | 21.9% |
| Standard Deviation (Population) | 15.9% | 21.8% |
Similar Demographics by Single Mother Poverty
Demographics Similar to Japanese by Single Mother Poverty
In terms of single mother poverty, the demographic groups most similar to Japanese are Czech (28.9%, a difference of 0.020%), Immigrants from Cambodia (28.9%, a difference of 0.080%), Scandinavian (28.9%, a difference of 0.10%), Immigrants from Nigeria (28.9%, a difference of 0.11%), and Immigrants from Kenya (28.9%, a difference of 0.11%).
| Demographics | Rating | Rank | Single Mother Poverty |
| Slovenes | 76.4 /100 | #153 | Good 28.8% |
| Portuguese | 73.2 /100 | #154 | Good 28.8% |
| Ugandans | 71.7 /100 | #155 | Good 28.8% |
| Iraqis | 71.5 /100 | #156 | Good 28.8% |
| Immigrants | Western Europe | 71.1 /100 | #157 | Good 28.9% |
| Immigrants | Hungary | 70.6 /100 | #158 | Good 28.9% |
| Czechs | 68.4 /100 | #159 | Good 28.9% |
| Japanese | 68.0 /100 | #160 | Good 28.9% |
| Immigrants | Cambodia | 66.6 /100 | #161 | Good 28.9% |
| Scandinavians | 66.2 /100 | #162 | Good 28.9% |
| Immigrants | Nigeria | 65.9 /100 | #163 | Good 28.9% |
| Immigrants | Kenya | 65.9 /100 | #164 | Good 28.9% |
| Arabs | 60.7 /100 | #165 | Good 29.0% |
| Inupiat | 60.4 /100 | #166 | Good 29.0% |
| Costa Ricans | 58.4 /100 | #167 | Average 29.0% |
Demographics Similar to Dutch by Single Mother Poverty
In terms of single mother poverty, the demographic groups most similar to Dutch are Alaskan Athabascan (30.3%, a difference of 0.040%), English (30.2%, a difference of 0.15%), Immigrants from Barbados (30.2%, a difference of 0.19%), Immigrants from Middle Africa (30.3%, a difference of 0.25%), and Immigrants from Nicaragua (30.3%, a difference of 0.25%).
| Demographics | Rating | Rank | Single Mother Poverty |
| Immigrants | Sudan | 6.5 /100 | #224 | Tragic 30.1% |
| Spanish | 6.3 /100 | #225 | Tragic 30.1% |
| Scottish | 6.0 /100 | #226 | Tragic 30.1% |
| Immigrants | Liberia | 5.9 /100 | #227 | Tragic 30.1% |
| Spaniards | 5.4 /100 | #228 | Tragic 30.2% |
| Immigrants | Barbados | 5.0 /100 | #229 | Tragic 30.2% |
| English | 4.8 /100 | #230 | Tragic 30.2% |
| Dutch | 4.3 /100 | #231 | Tragic 30.2% |
| Alaskan Athabascans | 4.1 /100 | #232 | Tragic 30.3% |
| Immigrants | Middle Africa | 3.5 /100 | #233 | Tragic 30.3% |
| Immigrants | Nicaragua | 3.5 /100 | #234 | Tragic 30.3% |
| Immigrants | Grenada | 3.4 /100 | #235 | Tragic 30.3% |
| Welsh | 3.2 /100 | #236 | Tragic 30.4% |
| Immigrants | St. Vincent and the Grenadines | 3.1 /100 | #237 | Tragic 30.4% |
| Slovaks | 2.8 /100 | #238 | Tragic 30.4% |